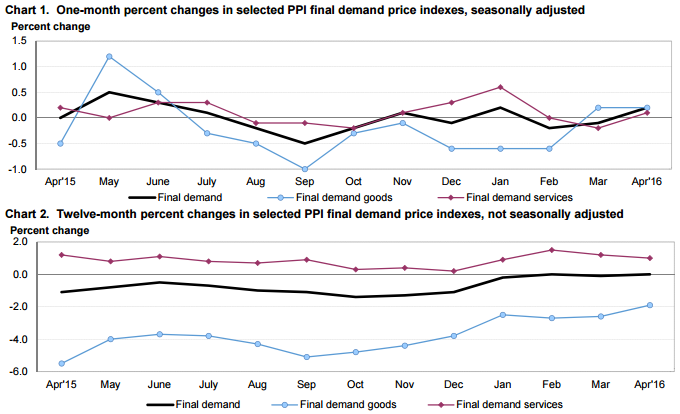
The Producer Price Index year-over-year inflation is zero. The intermediate processing continues to show a large deflation in the supply chain.

The PPI represents inflation pressure (or lack thereof) that migrates into consumer price.
The producer price inflation breakdown:

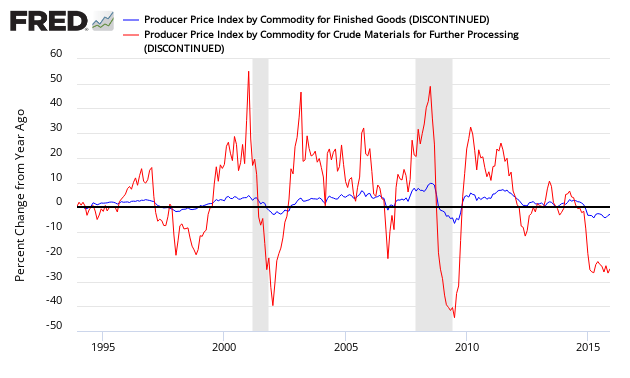
In the following graph, one can see the relationship between the year-over-year change in crude good index and the finish goods index. When the crude goods growth falls under finish goods – it usually drags finished goods lower.
Percent Change Year-over-Year – Comparing PPI Finished Goods (blue line) to PPI Crude Materials (red line)

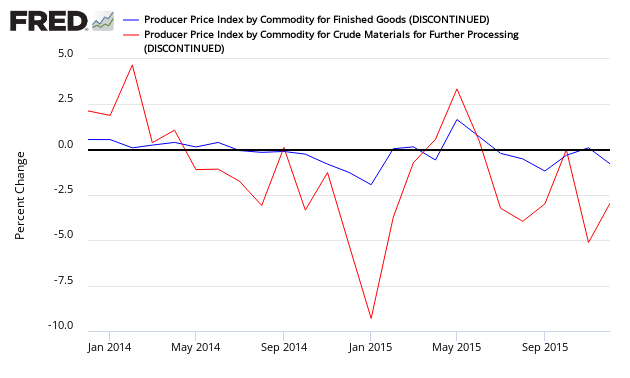
Percent Change Month-over-Month- Comparing PPI Finished Goods (blue line) to PPI Crude Materials (red line)

Removing food and energy (core PPI) was originally done to remove the noise from the index, however the usefulness in the twenty-first century is questionable except in certain specific circumstance.


Leave A Comment