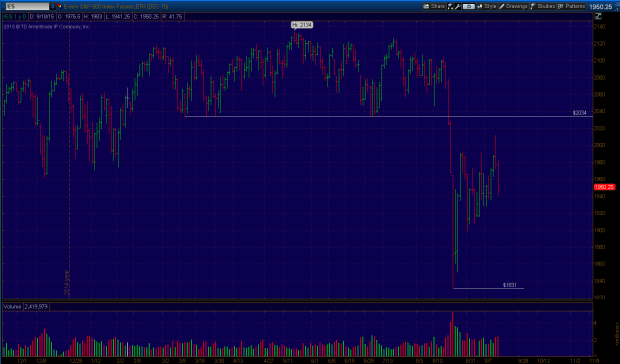
Predictions aside, traders and investors should be aware of recent market patterns to gain a better understanding of future potential outcomes. One such pattern in this bull market that begin in 2009 has been the tendency to revisit prior lows after volatile selloffs.
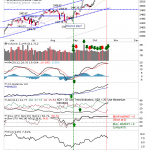
The chart above shows price action this year. After a very difficult and volatile August, stocks have leveled out and pushed back. After this week’s FOMC announcement and the Fed’s decision not to raise the short term interest rate (for now), stocks started to resume the selloff. Before we begin talking about future potential outcomes, let’s take a look at past corrections inside of this bull market.
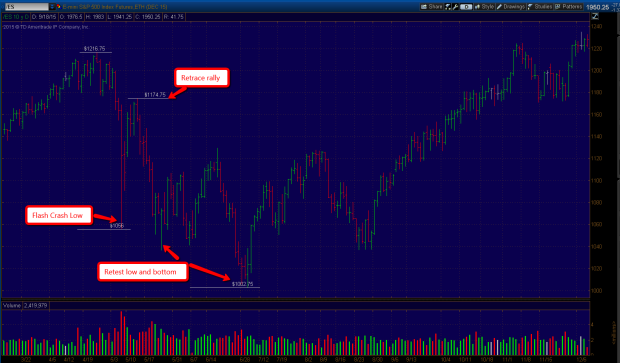
In May 2010 the stock market experienced a “flash crash”, where for about 30 minutes the market fell straight down as the Dow would drop almost 1,000 points in what seemed like an instant, before reversing much of the loss before the close. The market would continue to rally for a few more days before sellers once again took over. The low that was created during the crash was once again retested, on a few occasions in this case. Eventually the market would find support after a correction of 17.5% from intra-day high to low, six months later a new bull market high would be established.
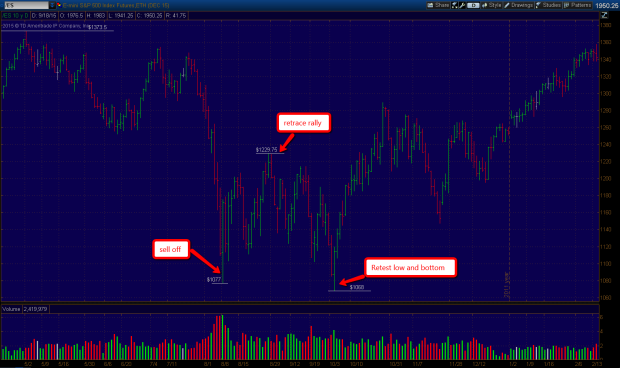
A year later news of a Europe economic crash and US debt market downgrade sent stocks down in a hurry once again. At one point the S&P 500 closed lower on 10 of 11 trading days before the descent was stopped and a retrace rally began. Sellers would once again take control and the market would head lower to retest the prior lows again. This produced between a 15-22% correction depending on what index and chart you look at. It would take about six months to recover the losses of 2011 and make a new bull market high. But the S&P 500 would go on to double in value from the 2011 lows to the 2015 highs.
Whoever tells you that this bull market has been easy money is lying. The fear and volatility experienced during this six year rally has been unlike none other.





Leave A Comment