With stocks up and treasuries down, there were a couple of interesting contrary trades today in my view. For one, oil prices at the front end of the futures curve did not participate and have been down since the last FOMC non-decision. That may suggest funding and financing, as the overall curve steepened slightly where the front month was flat to yesterday’s close but there was some buying in the maturities thereafter; the October 2016 contract, for instance, was up $0.46 today (as of this writing).
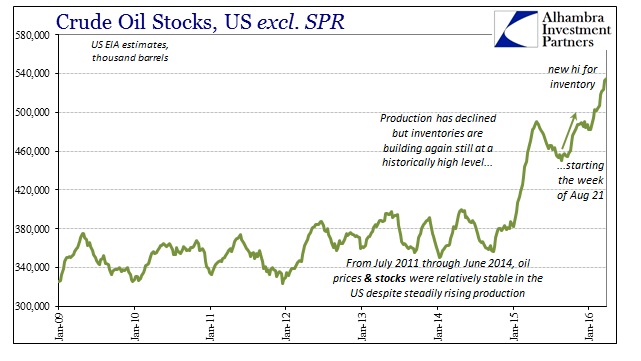
The fundamental imbalance in oil has only gotten worse despite the burst of enthusiasm since February 11. The US EIA’s latest weekly update shows yet another record in US crude inventories, with increases in twenty-three of the past twenty-seven weeks. The total stock of crude oil (not counting the SPR) is up 13.4% from the same week in 2015; which was already 24% more than the year before that. So over the past two years, crude inventory has surged by just more than 40%; and unthinkable quantity that cannot count as just a “supply glut”, especially as those two inventory surges quite nicely match the two massive oil crashes that preceded them.

Crude production fell to just above 9 mbpd, the lowest weekly output since late 2014. That is significant economically as it suggests further weakness still to come out of the oil patch, especially since whatever supply reductions since the middle of last year haven’t done anything toward the physical crude imbalance.

So where the fundamentals of oil continue to be atrocious, it is suggestive that oil in financial terms which had ignored it all over the past nearly two months may now be “finding” it again. To that end, I found it significant that the euro/dollar curve was also contrary to the rest of the major market action. Having been bid heavily yesterday, euro/dollar futures continued today in the “wrong” direction. That continues the conspicuous trend established also at the last FOMC meeting.


Leave A Comment