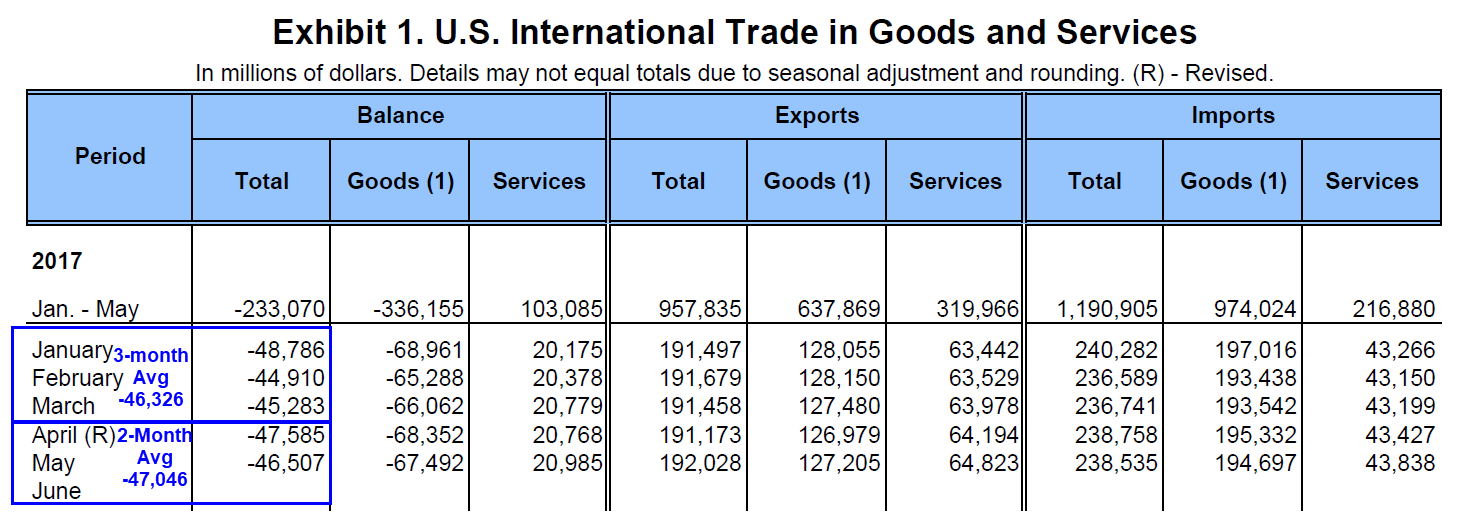
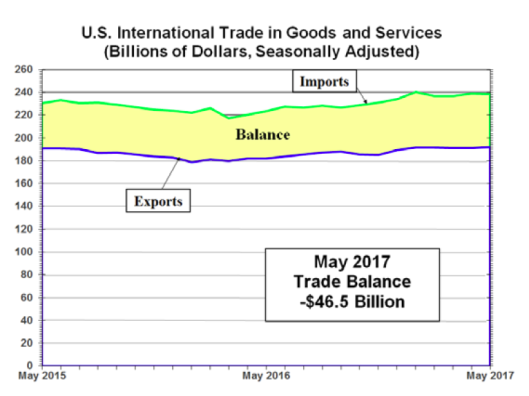
Today the BEA reported the US trade deficit was $-46.5 billion. The Econoday economists’ consensus estimate of $-46.2 billion for international trade was nearly on the mark, but the advance reading on goods pointed the way.
The nation’s trade gap came in very near expectations in May, at $46.5 billion vs Econoday’s consensus for $46.2 billion and under April’s $47.6 billion. Exports rose a constructive 0.4 percent in the month to $192.0 billion while, in another positive for the deficit, imports edged 0.1 percent lower to $238.5 billion.
The strength in exports is centered once again in services where the surplus rose 1.0 percent to $64.8 billion. Demand for U.S. services is tied to the nation’s technical and managerial skills. Exports of goods also rose, up 0.2 percent to $127.2 billion and reflecting a welcome $0.9 billion jump in consumer goods to $16.7 billion. Auto exports were also strong, up $0.6 billion to $13.2 billion.
Demand for imports is centered in capital goods, up $1.3 billion in the month to $52.8 billion which, in this case, is positive for the U.S. economy pointing to increased domestic investment in future output improvements and productivity. Crude oil imports, always a negative in the trade data, rose $0.5 billion to a monthly $11.8 billion.
By country, the nation’s trade gap with China widened to $31.6 billion in May from April’s $27.6 billion with Mexico also showing a large increase to $7.3 billion from $6.3 billion (note that country data, unlike other data in this report, are unadjusted for seasonal and calendar variations).
The nation’s trade imbalance is running about even with earlier in the year pointing, with June data still to go, to little effect for second-quarter GDP.
Balance of Trade

Balance of Trade vs. First Quarter

Compared to the first quarter, the trade deficit is running slightly higher on average. With one month left to go, net exports rate to subtract a bit from second quarter GDP (-0.2 to -0.5 percentage points). To pick a specific number, call it -0.35.


Leave A Comment