BTC/USD
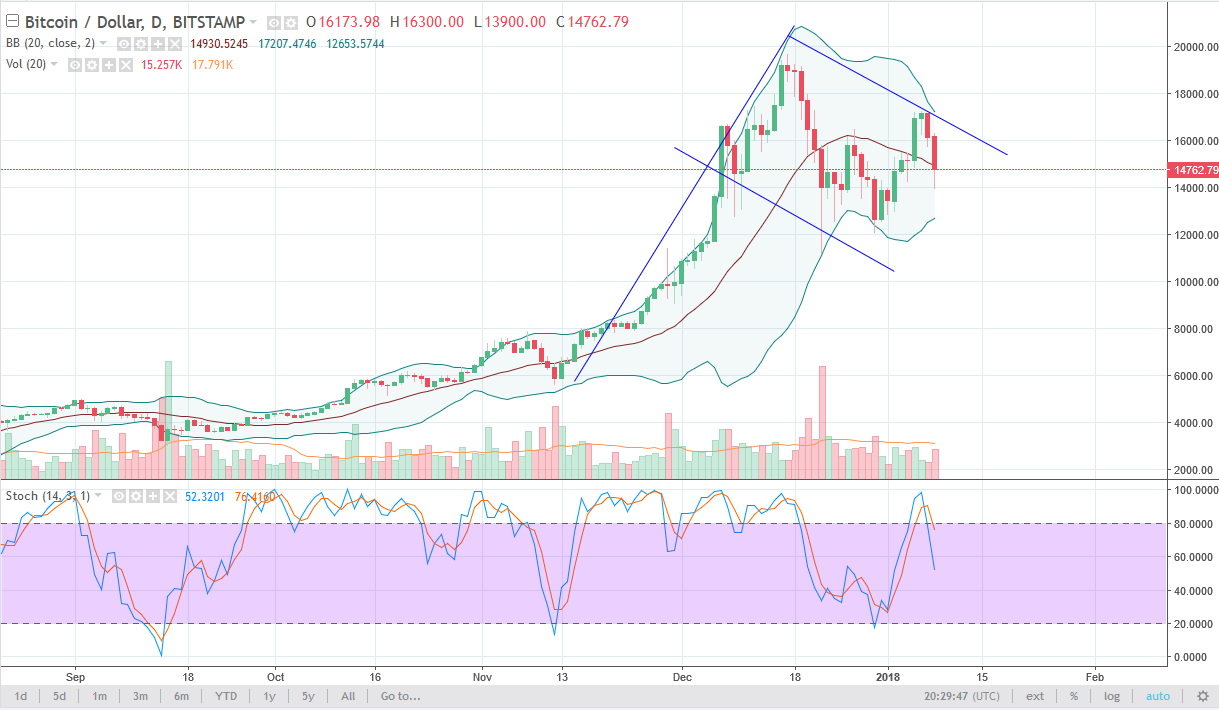
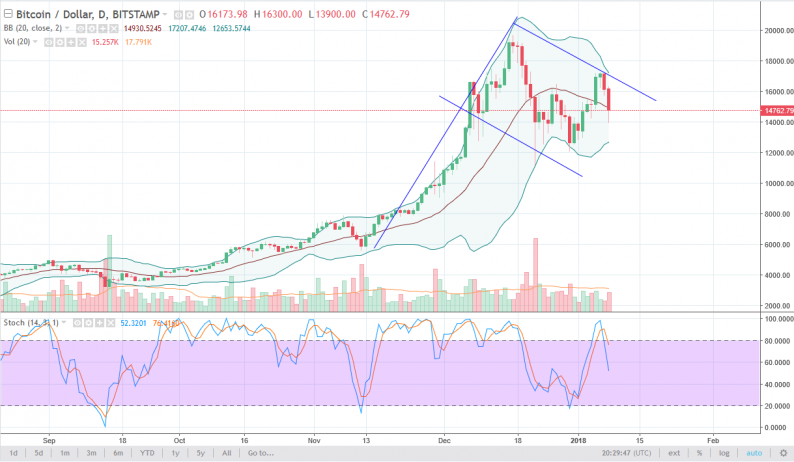
Bitcoin fell against the United States Dollar during the trading session on Monday, as traders came back to work. It looks likely that the market could continue to drift a bit lower, but as you can see on the daily chart, I have formed a bullish flag that could happen. If we can break above the downtrend line marked on the chart, that should send this market much higher. The $12,000 level underneath should be massively supportive, and if we can break down below, where I think it’s the beginning of a serious trouble for Bitcoin. Otherwise, we could break out to the upside and go much higher, with a potential target of $30,000 based upon the pole of the flag.

BTC/JPY
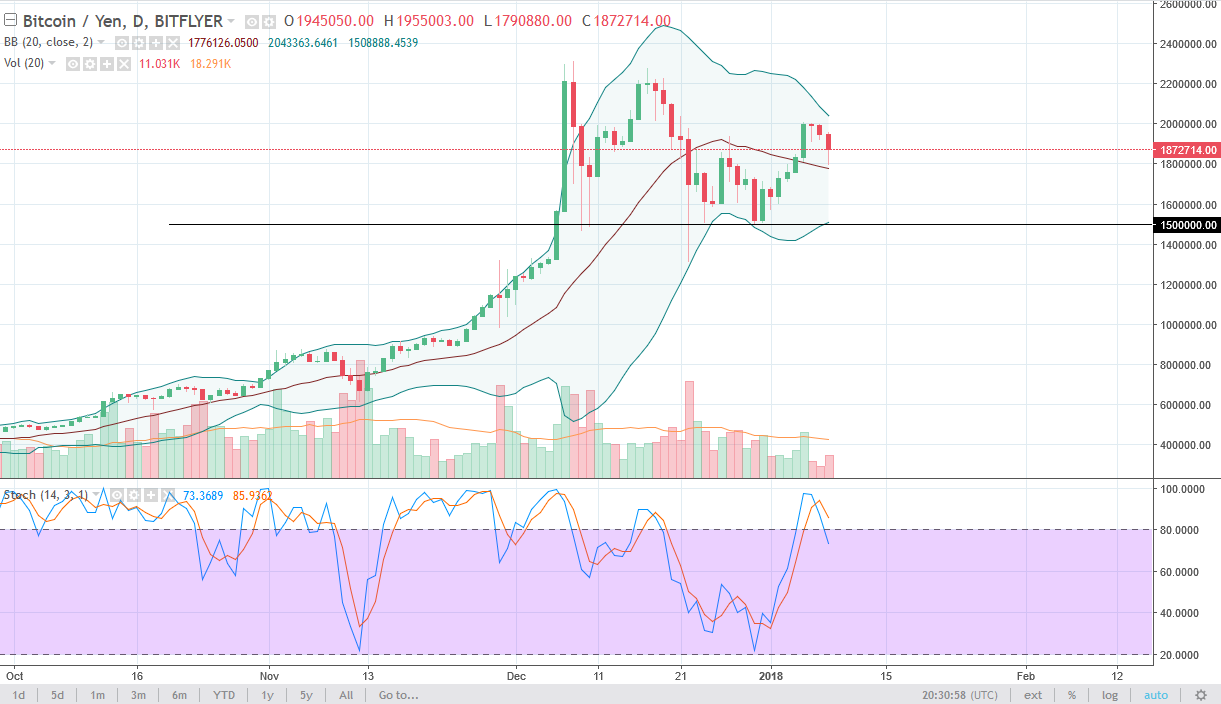
Bitcoin struggled a bit against the Japanese yen as well, and on the stochastic oscillator, we are in the overbought part of the indicator, and have crossed the moving averages. This suggests that the market is going to go lower from here, but I think that there is a significant amount of a support at the ¥1.5 million level. If we can stay above there, the market should continue to go higher, but if we were to break down below that level, that would be very negative for Bitcoin and could send it down to ¥1 million. I believe that the ¥1.5 million level is one of the most important levels on the chart, and therefore it should attract a lot of attention. Alternately, if we turn around and rally from here, a break above the ¥2 million level sends the market towards the 2.25 million level next, which was the recent highs in the market.


Leave A Comment