Bitcoin is quite volatile, to say the least. The price has been surging only to collapse and only to rise again. Yet within this noise, one can find a trend.
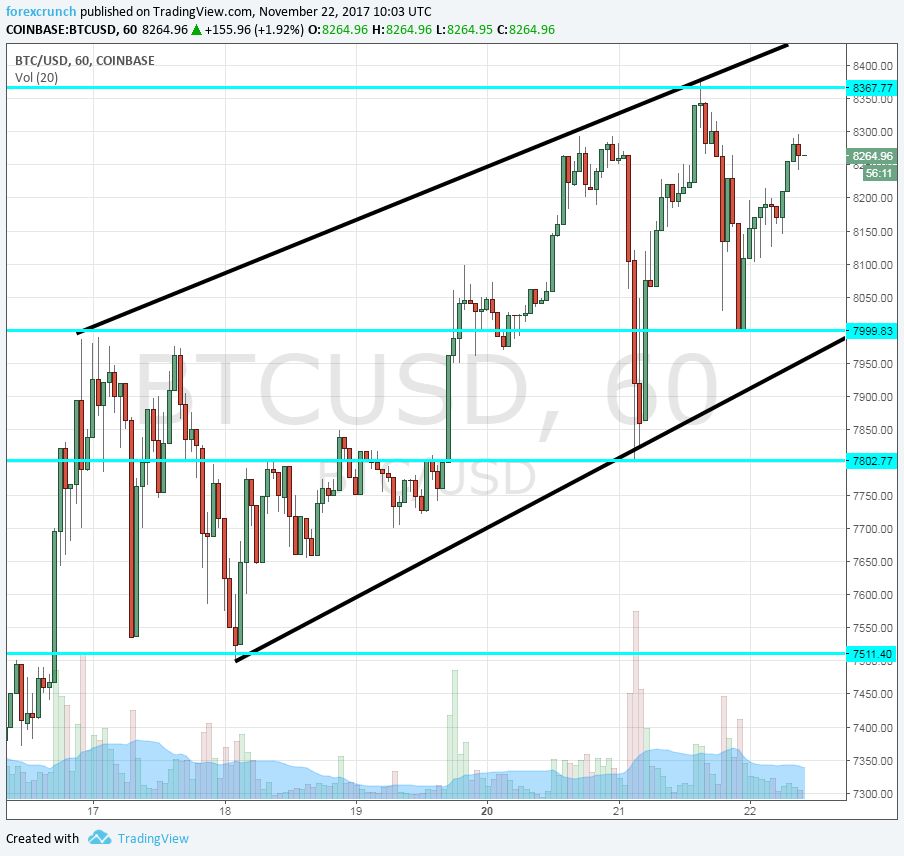
BTC/USD is making higher highs and higher lows, marking a clear uptrend in the past week. It is looking a bit more rational than the headlines would suggest.
Uptrend support begins at $7511 which was a swing low on November 18th and also served as resistance on November 16th. It was then formed on the 21st at $7802 and we see another higher high on the 22nd at $7998.
That last higher high coincides with the beginning of the uptrend resistance line. On November 16th we see a failed challenge just under $8000. It was followed by a higher high at $100. quickly followed by $8200 which forms this uptrend resistance. Yet another confirmation of the line was sen at the recent peak at $8367.
At the time of writing, the price is $8280, more or less in the middle of the trade. What is the trade? “Make the trend your friend” is an old saying that is also relevant for the electronic currency. So, going long makes more sense than going short.
But where is the entry point? The price may make another higher low, somewhere above $8000 but not too close that previous higher low. And where can one take profit? Probably not too much about $8400. The price does not usually touch the very bottom of the uptrend channel nor the top.
The chart tells the full story.


Leave A Comment