Introduction
We remain in one of the longest bull markets in history. Generally, with bull markets, stocks tend to become highly valued. Additionally, we also continue to find ourselves in a low-interest rate environment based on historical standards. However, after bottoming out in January 2017, interest rates have steadily increased. Although interest rates remain low based on historical norms, the fear of rates rising in the future has begun to unsettle the stock market.
So far, October 2018 has brought us dropping stock prices. Consequently, there has been the beginnings at least of a correction in the valuations of many high-quality dividend growth stocks. This is important because, for the most part, high-quality dividend growth stocks had become quite expensive. Although the correction has been broad-based, there are certain sectors such as the financial sector and the healthcare sector that have been hardest hit.
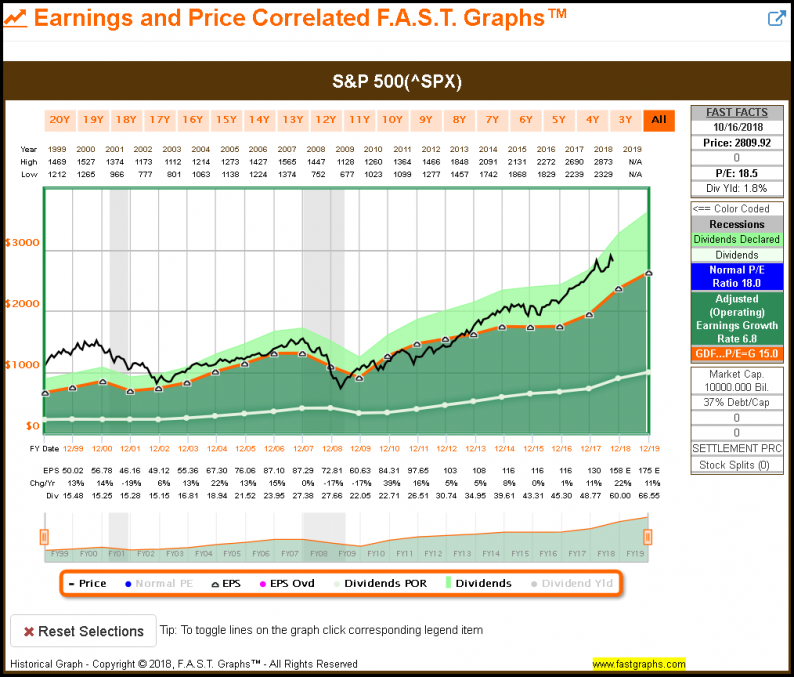
Furthermore, although stock prices have generally been falling recently, I think we are far from calling it a true correction and certainly far from calling it a bear market. The following earnings and price correlated FAST Graph on the S&P 500 puts the recent weakness into a clear perspective.
The S&P 500 Current Valuation Based On Past Results
The following earnings and price correlated FAST Graph on the S&P 500 since the calendar year 1999 illustrates the overvaluation that has become manifest since the Fall of 2013. Moreover, we see that the dropping stock prices experienced this month had not made a material difference in valuation. Obviously, every little bit helps, but the S&P 500’s valuation remains high based on historical norms and a longer-term earnings growth rate of 6.8%.

The S&P 500 Valuation Based on Forecasts
From a historical perspective seen above, the S&P 500 is clearly overvalued. On the other hand, from a future perspective, it can be argued that the S&P 500 is simply fully valued but within the valuation, corridor depicted by the light orange lines on the forecasting calculator below. The primary differentiator is a forecast for future growth of 16% versus the historical growth of 6.8% we saw on the long-term historical graph.


Leave A Comment