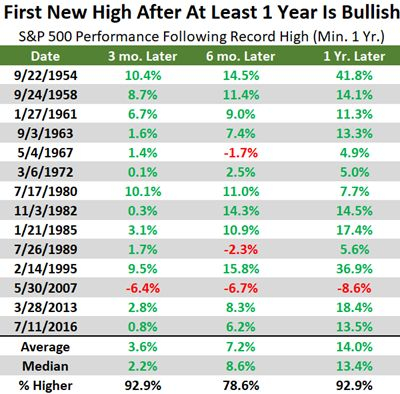
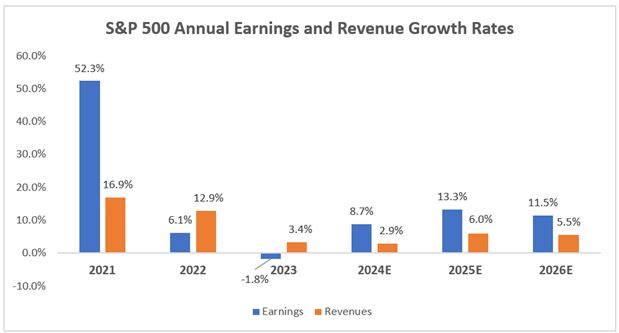
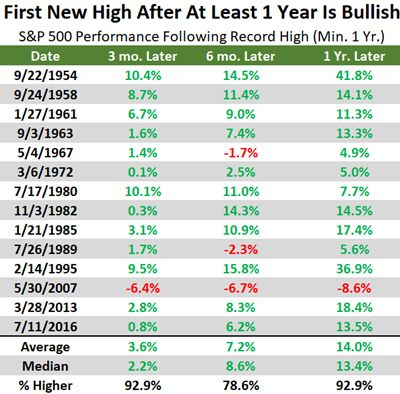
This new bull market had its first birthday late last year, and the development we’ve seen as it turned two has been nothing short of remarkable. The rally has broadened out in its second year, showing strong participation as the major U.S. indices eclipse their former highs. As we’ll see, a confluence of fundamental and seasonal forces points to a high likelihood that market returns in 2024 will surprise to the upside.With stocks at all-time highs, it’s somewhat normal to be apprehensive in terms of buying at these levels. The prevailing thought in most investors’ minds is – why not just wait for a correction and buy at lower prices?But the market is telling us that it is resuming the longer-term secular bullish trend. The biggest mistake we can make early in a new bull market is thinking stocks look expensive just because the index price is high.History has shown us that buying at all-time highs can be very lucrative. The S&P 500 closed at a record high back in January for the 1st time in two years. Dating back to 1928, when the S&P hits a new all-time high after more than 1 year without one, a year later the index averaged a 14% return and has been higher nearly 93% of the time. Image Source: Zacks Investment ResearchThe ability of stocks to surpass former resistance levels and break out to all-time highs is a key signal. Remember, stocks are a leading indicator when it comes to the economy. Fundamental Drivers Support Rise in StocksThe two primary drivers of stock market prices are corporate earnings and economic activity. The recent fourth-quarter earnings results provided us with more evidence that this new bull market is being supported by a resilient corporate backdrop. As has been the case for months now, earnings once again turned out to be better than many market participants had feared, reinforcing the notion that this new bull market can be sustained.The fourth quarter of last year will go down as the second consecutive quarter of earnings growth, after Q3 of 2023 officially halted the earnings recession. Total S&P 500 earnings for Q4 are expected to be up 6.5% from the same period in the prior year on 3.8% higher revenues. The earnings growth rate is the best we’ve seen since the second quarter of 2022, while the 3.8% revenue growth rate also represents a notable acceleration relative to the last few quarterly cycles.Looking at the full-year picture, total S&P 500 earnings are expected to increase 8.7% on 2.9% higher revenues in 2024. The takeaway here is that the earnings recession is in the rearview mirror and markets are expecting a return to growth in the months and years ahead.
  Image Source: Zacks Investment ResearchIn terms of economic activity, I think the big story is productivity growth. The Bureau of Labor Statistics reported that Q4 productivity rose at a 3.2% annualized pace, helping fuel economic growth as inflation receded. We’ve seen a resurgence in productivity growth, boosted by the artificial intelligence theme.Looking back at history, growth in labor productivity during the ’70s was only 1%. This was also a period of higher inflation and higher wages. It rose a bit to 1.8% in the ‘80s to mid-90s, then technological advancements (including wide adoption of the internet) piloted in a period of 3%. Productivity growth fell again for much of the last two decades, but the last three quarters we’re running at a 3.9% annualized pace.It appears a new era of above-average productivity growth is underway. This has shades of the 1990s and is a big deal, as heightened productivity can usher in an era of strong wage growth and lower inflation, which gives the Fed room to cut interest rates.The Fed’s preferred measure of inflation (Core PCE) moved down to 2.85% in January, which was the lowest level since March 2021. This is a measure of prices that U.S. consumers pay for goods and services that strips out two categories that tend to have volatile price swings (food and energy). These components are left out to make the underlying inflation trend easier to see.
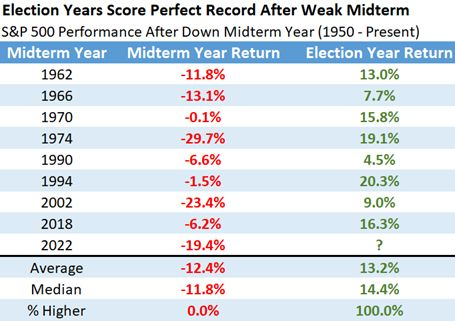
  Image Source: Bureau of Economic AnalysisClearly the trend is down here, but more importantly the Fed Funds Rate is now 2.4% above Core PCE, resulting in the most restrictive monetary policy we’ve seen dating back to September 2007. In other words, interest rate cuts are on the way, it’s just a matter of when. We’ll get an update to the PCE index (February figures) later this month. How Will Markets Fare Amid Interest Rate Cuts?We all know that the Fed has reached the end of its hiking cycle and now has interest rate cuts in sight. From a historical perspective, the start of the easing process has been bullish. Going all the way back to 1921 and spanning 24 periods, the DJIA advanced an average of 15% a year following the first cut.The narrative surrounding interest rate cuts becomes even better when we factor in whether or not the economy was in a recession. When the Fed has avoided recession, stocks have ripped higher, up 24% on average a year later.In addition, the Fed has made it clear that it plans to cut rates slowly. The S&P 500 widely outperforms in the 1st year of slow easing cycles versus fast ones. Why is that the case? Because in fast easing cycles, it usually means something has gone wrong (such as the start of easing cycles in 2001 and 2007). But in this case, with the economy on sound footing, a slow easing cycle should bode well for stock returns.Regardless of what you’ve heard in the financial media, interest rate cuts don’t have to doom stocks, particularly when there is no recession and a slow easing cycle. Election And Seasonal Cycle Stats Point to More Strength AheadWe’re in the 4th year of President Biden’s term. Another reason to be bullish is the fact that election years tend to see enhanced gains when we have a new President that’s still in his first term. Dating back to 1950, the S&P 500 gains an average of 12.2% under new Presidents, far above the typical election year return of 7.3%.In presidential cycles where we’ve had a down midterm year (2022 in this case), we’ve never had a lower election year since 1950. The S&P 500 boasts an average return of 13.2% under these circumstances.
  Image Source: Zacks Investment ResearchFrom a seasonal perspective, the S&P 500 climbed in each of the past four months (November, December, January, and February), an astonishing rally that will go down in the history books. Interestingly, when this has occurred in the past, the full calendar year has also never been lower. The feat has occurred 14 times in the past, and each time the S&P 500 has been higher at the end of the year, up an incredible 21.2% on average.As the saying goes, strength begets strength. An object in motion tends to stay in motion. The seasonal statistics are certainly pointing to an above-average year in 2024. Final ThoughtsThere are many reasons to be optimistic in the second year of this new bull market. Buying at new all-time highs has proven to be highly profitable, as the unchartered territory is the market’s way of telling us to expect more strength ahead. The move in stocks is undoubtedly supported by fundamentals including earnings growth and a resilient economy.We shouldn’t fear interest rate cuts, as stocks have performed admirably after the central bank begins the easing process. And given that we’re in an election year that is showing a trending market and little volatility, the probability of further gains ahead remains enticing from a historical perspective.Here’s to hoping history rhymes once again.More By This Author:Walmart Declines More Than Market: Some Information For InvestorsTime To Buy The Dip In Nike Or Lululemon’s Stock After Earnings? 5 Reasons to Buy Housing ETFs Now


Leave A Comment