The support levels which were on offer for the Russell 2000, Dow Jones Industrial Average and S&P were undone by the biggest one-day loss in the year. on Oct. 10. Not surprisingly, volume rose in distribution as traders bailed.The only index to finish on support was the Nasdaq 100. Although with a 4%+ loss it would be a brave trader to be buying the 200-day MA.
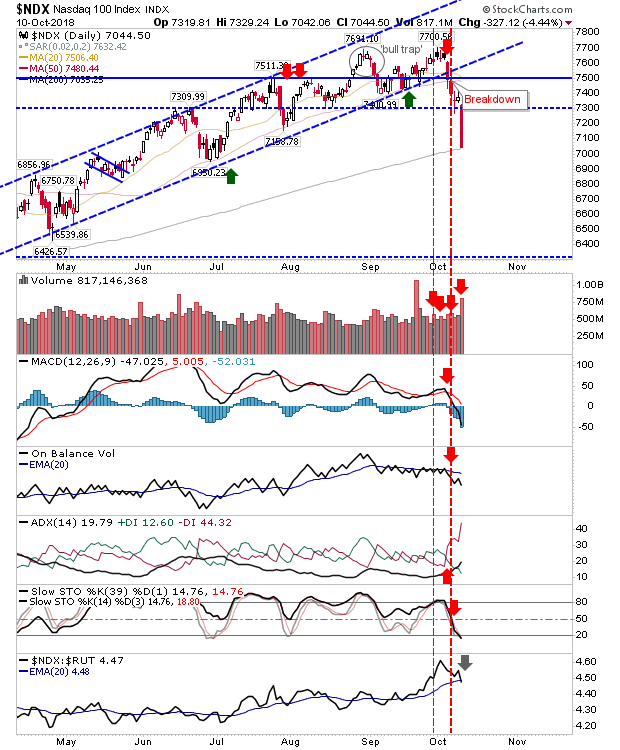
The S&P is heading towards its 200-day MA and closed just a shade below minor horizontal support. A relief bounce is likely but it’s questionable how long it will last. Technicals turned net bearish so a new intermediate length (3 weeks to 3 month) down phase has begun.
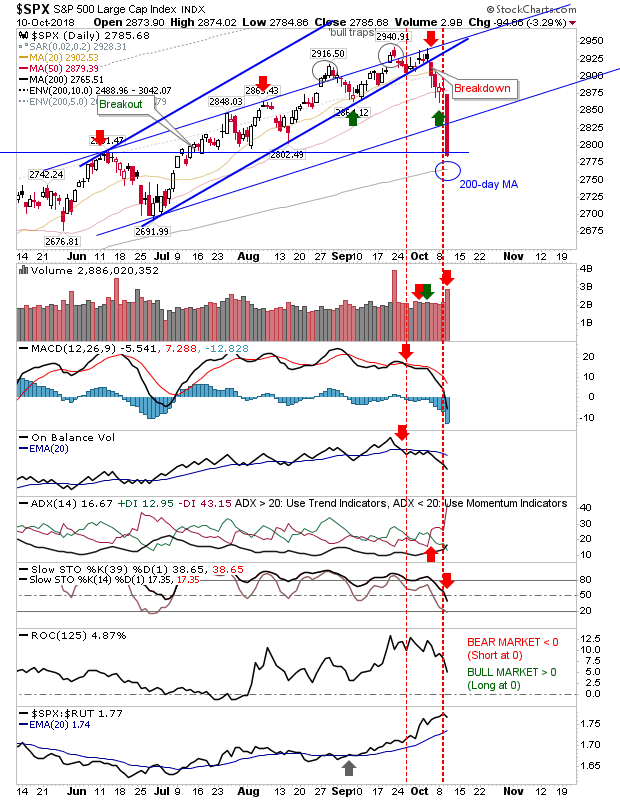
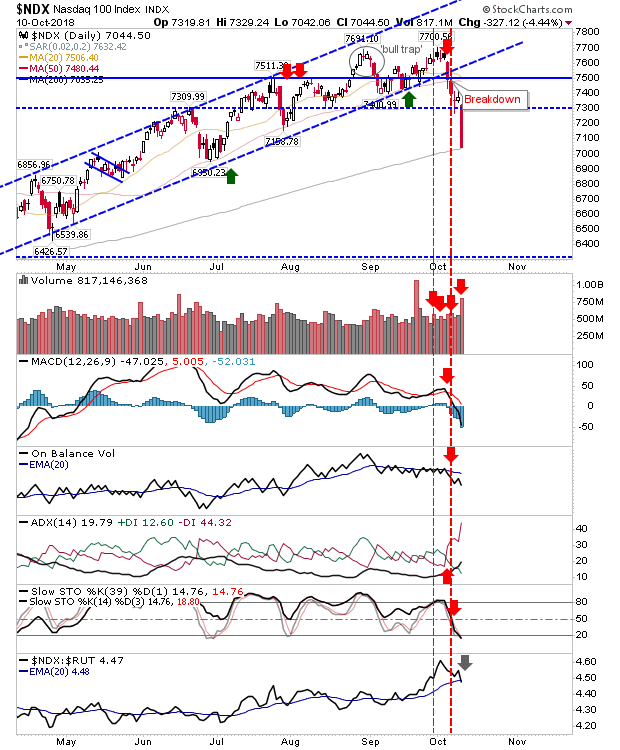
The Nasdaq didn’t stall at its 200-day MA, which is not good news for other indices. Technicals are all net bearish as relative performance accelerated lower.
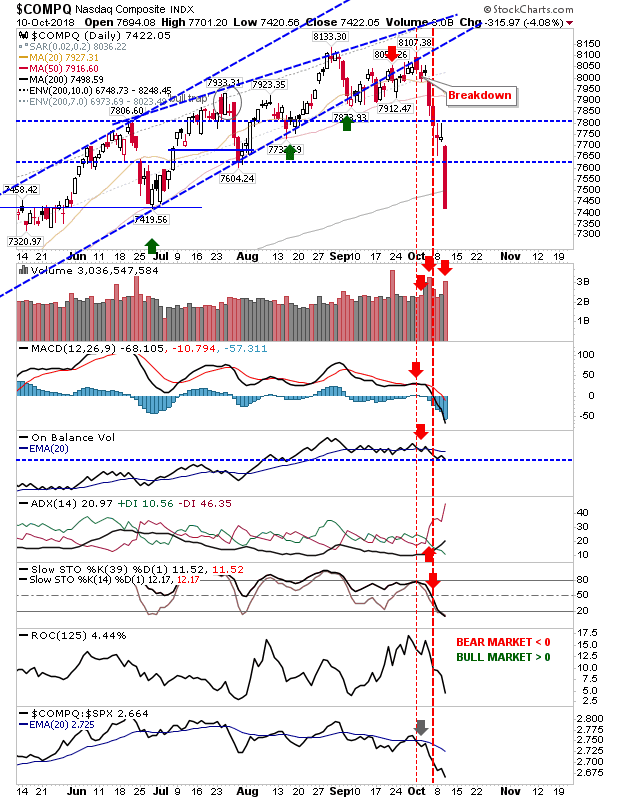
Semiconductors continued their rout.The CCI is deeply oversold as relative performance builds a slow reversal with price testing April/May swing lows. Shorts should be looking to take profits and even aggressive buyers could fish around today’s close.
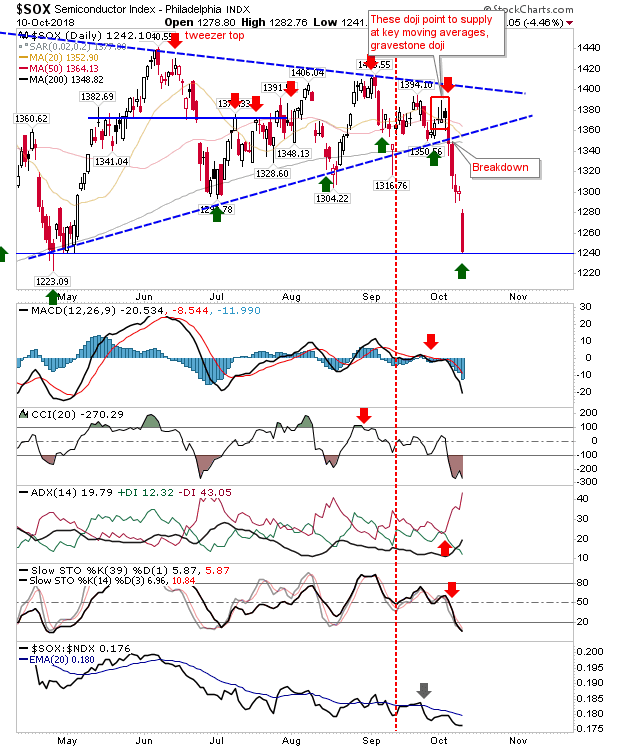
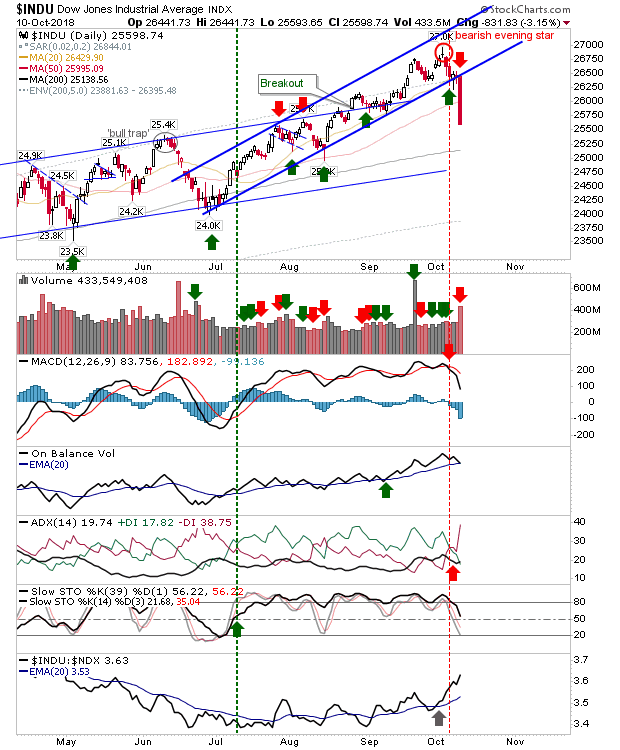
After hugging channel support the Dow Jones Industrial Average finally cut loose and burned through channel support. It failed to stop at its 50-day MA and is now looking at its 200-day MA. There was no other technical change although the big red candlestick was damaging enough.
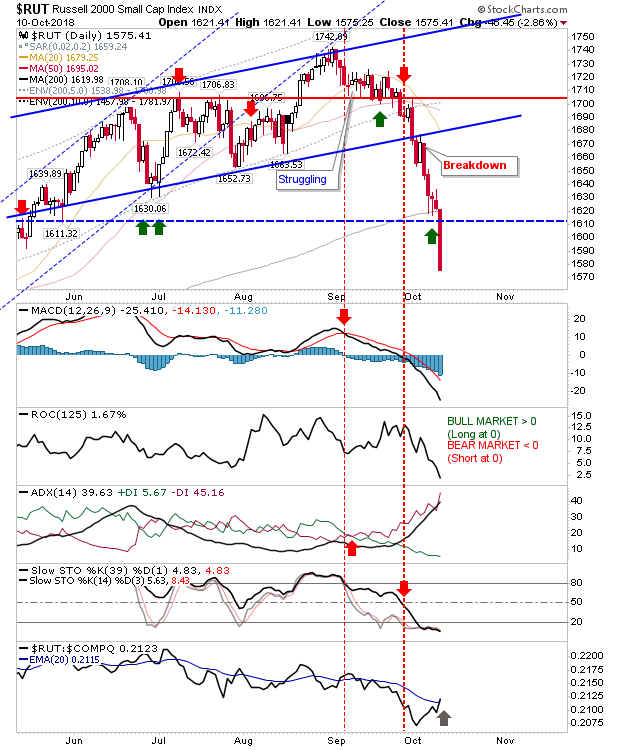
The Russell 2000 wasn’t able to defend its 200-day MA and sold off with an undercut of the stop of the 200-day MA buy signal. Ironically, this came with a bullish cross in relative performance – this index is the strongest of the weakest.
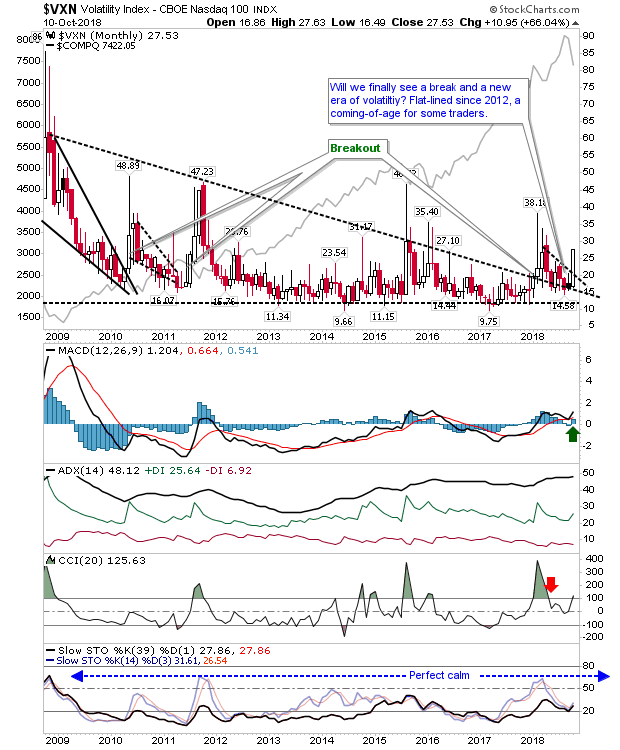
Oct. 11 has a good chance for a relief bounce but buying for the long-term would still be a little early. The volatility bounce looks to be in play too; a time to end the multi-year period of calm?



Leave A Comment