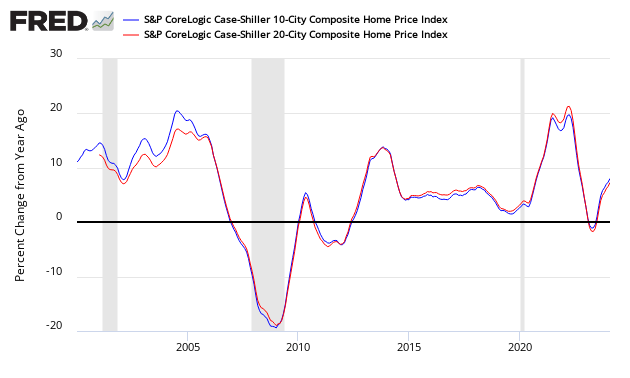
The non-seasonally adjusted Case-Shiller home price index (20 cities) year-over-year rate of home price growth rose from 6.3 % to 6.4 %. The index authors stated, “Two factors supporting price increases are the low inventory of homes for sale and the low vacancy rate among owner-occupied housing.”

Analyst Opinion of Case-Shiller HPI
Many pundits believe home prices are back in a bubble. Maybe, but the falling inventory of homes for sale keeps home prices relatively high. I continue to see this a situation of supply and demand. It is the affordability of the homes which is becoming an issue for the lower segments of consumers.
S&P/Case-Shiller Home Price Indices Year-over-Year Change

Comparing all the home price indices, it needs to be understood each of the indices uses a unique methodology in compiling their index – and no index is perfect.
The way to understand the dynamics of home prices is to watch the direction of the rate of change. Here home price growth generally appears to stabilize (rate of growth not rising or falling).
There are some differences between the indices on the rate of “recovery” of home prices.
A synopsis of Authors of the Leading Indices:
Case Shiller’s David M. Blitzer, Chairman of the Index Committee at S&P Indices:
The home price surge continues. Since the market bottom in December 2012, the S&P Corelogic Case-Shiller National Home Price index has climbed at a 4.7% real – inflation adjusted – annual rate. That is twice the rate of economic growth as measured by the GDP. While price gains vary from city to city, there are few, if any, really weak spots. Seattle, up 12.9% in the last year, continues to see the largest gains, followed by Las Vegas up 11.1% over the same period. Even Chicago and Washington, the cities with the smallest price gains, saw a 2.4% annual increase in home prices.
Two factors supporting price increases are the low inventory of homes for sale and the low vacancy rate among owner-occupied housing. The current months-supply — how many months at the current sales rate would be needed to absorb homes currently for sale — is 3.4; the average since 2000 is 6.0 months, and the high in July 2010 was 11.9. Currently, the homeowner vacancy rate is 1.6% compared to an average of 2.1% since 2000; it peaked in 2010 at 2.7%. Despite limited supplies, rising prices, and higher mortgage rates, affordability is not a concern. Affordability measures published by the National Association of Realtors show that a family with a median income could comfortably afford a mortgage for a median priced home.


Leave A Comment