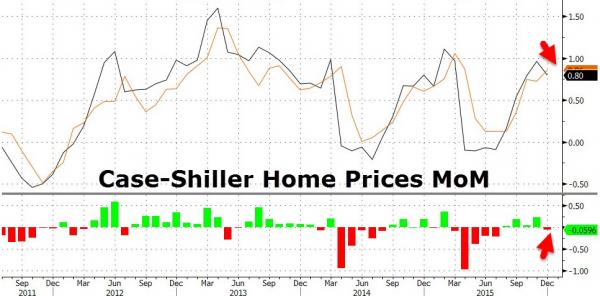
After four months of hope-strewn expectation beats, Case-Shiller’s home price index missed expectations with MoM growth slowing from 0.96% to 0.8% (and YoY from 5.83% to 5.74%). This is the first inflection in the resurrection of home-price acceleration since June, and we are sure will be blamed on the weather and the stock market. Perhaps most notably Miami and New York saw prices drop MoM as the smoking-gun canaries in the coalmine of real estate speculation remain well worth watching.
Did the cycle just turn again?

“While home prices continue to rise, the pace is slowing a bit,” says David M. Blitzer, Managing Director and Chairman of the Index Committee at S&P Dow Jones Indices.
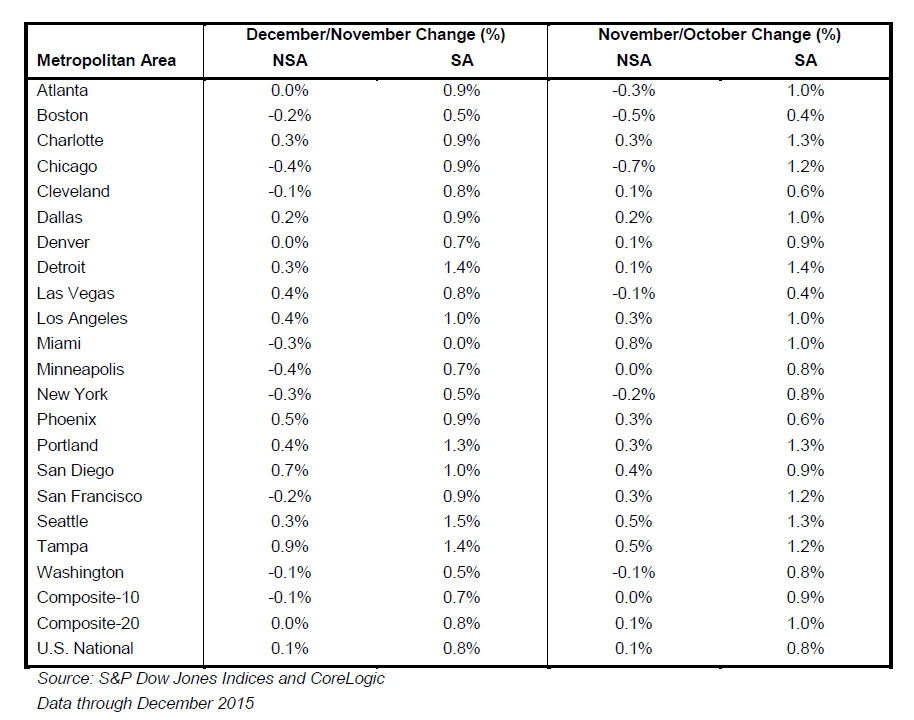
“Seasonally adjusted, Miami had lower prices this month than last and 10 other cities saw smaller increases than last month. Year-over-year, seven cities saw the rate of price increases wane. Even with some moderation, home prices in all but one city are rising faster than the 2.2% year-over-year increase in the CPI core rate of inflation.
“Sparked by the stock market’s turmoil since the beginning of the year, some are concerned that the current economic expansion is aging quite rapidly. The recovery is six years old, but recoveries do not typically die of old age. Housing construction, like much of the economy, got off to a slow start in 2009-2010 and is only now beginning to show some serious strength. Continued increases in prices of existing homes, as shown in the S&P/Case-Shiiller Home Price Indices, should encourage further activity in new construction. Total housing starts have stayed above an annual rate of one million starts per year since last March and single family home have been higher than 700,000 units at annual rates since June. Housing investment continues its positive contribution to GDP growth.”
The breakdown shows New York and Miami with the biggest drop MoM…

Portland, San Francisco and Denver continue to report the highest year over year gains among the 20 cities with another month of double digit annual price increases. Portland led the way with an 11.4% year-over-year price increase, followed by San Francisco with 10.3% and Denver with a 10.2% increase. Thirteen cities reported greater price increases in the year ending December 2015 versus the year ending November 2015. Phoenix had the longest streak of year-over-year increases, reporting a gain of 6.3% in December 2015, and the twelfth consecutive increase in annual price gains. Detroit posted a 7.1% year-over-year price, up from 6.3%, the largest annual increase this month.


Leave A Comment