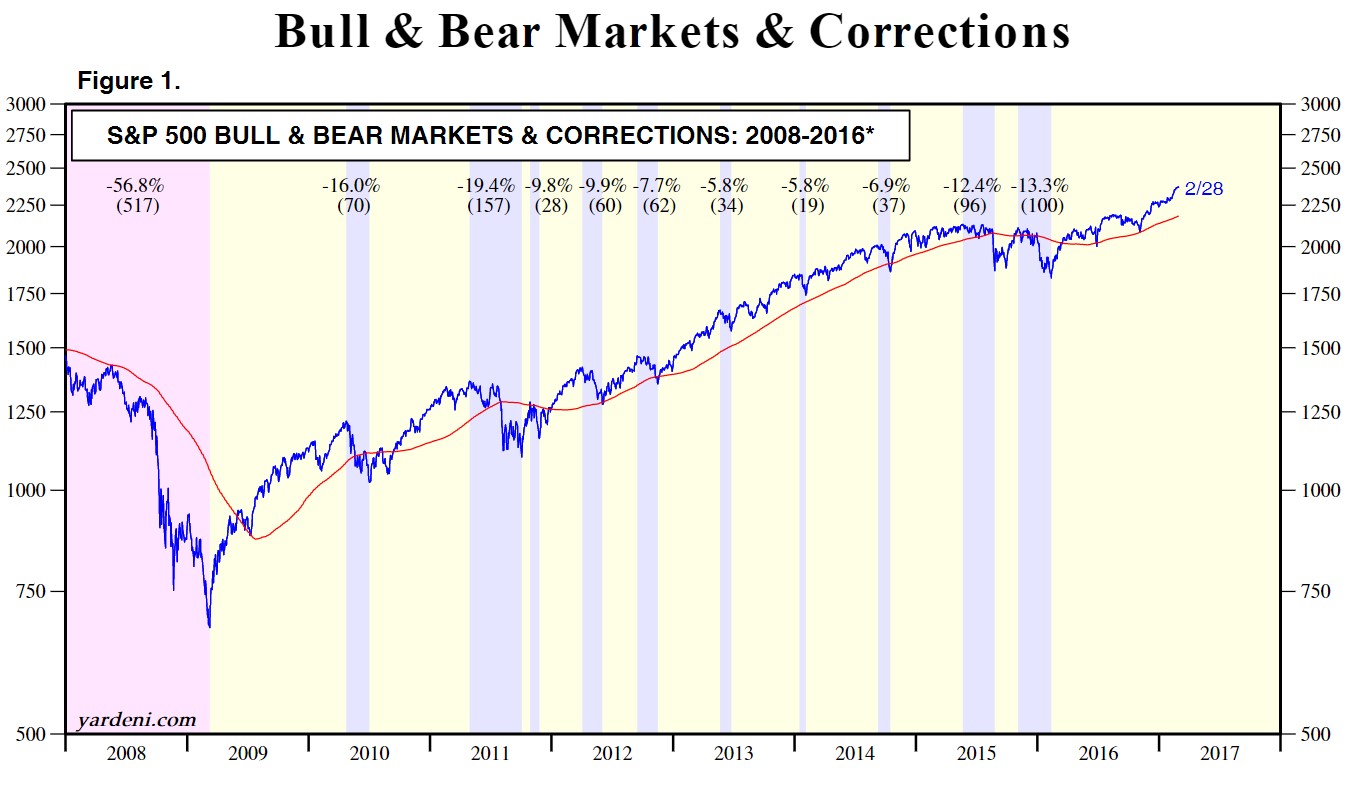
I have been discussing the lack of a 1% move in the S&P 500 for a few weeks now. This streak finally ended Wednesday as it rose 1.37%. The next streak which is much more ominous is the 96-day streak without a 1% decline in the S&P 500. The idea of a 5% correction happening anytime soon seems impossible. The chart below shows the corrections since the start of the bull market. The market is currently in the longest stretch of this cycle without having a 5% fall. When this reverses, the crash will only be greater now that the market has overstretched itself beyond most investors’ imaginations. Bank of America raised its year end S&P 500 target from 2,300 to 2,450. The S&P 500 can easily meet 2,450 in March. It would be shocking to see an upgraded target for the whole year reached in the third month.

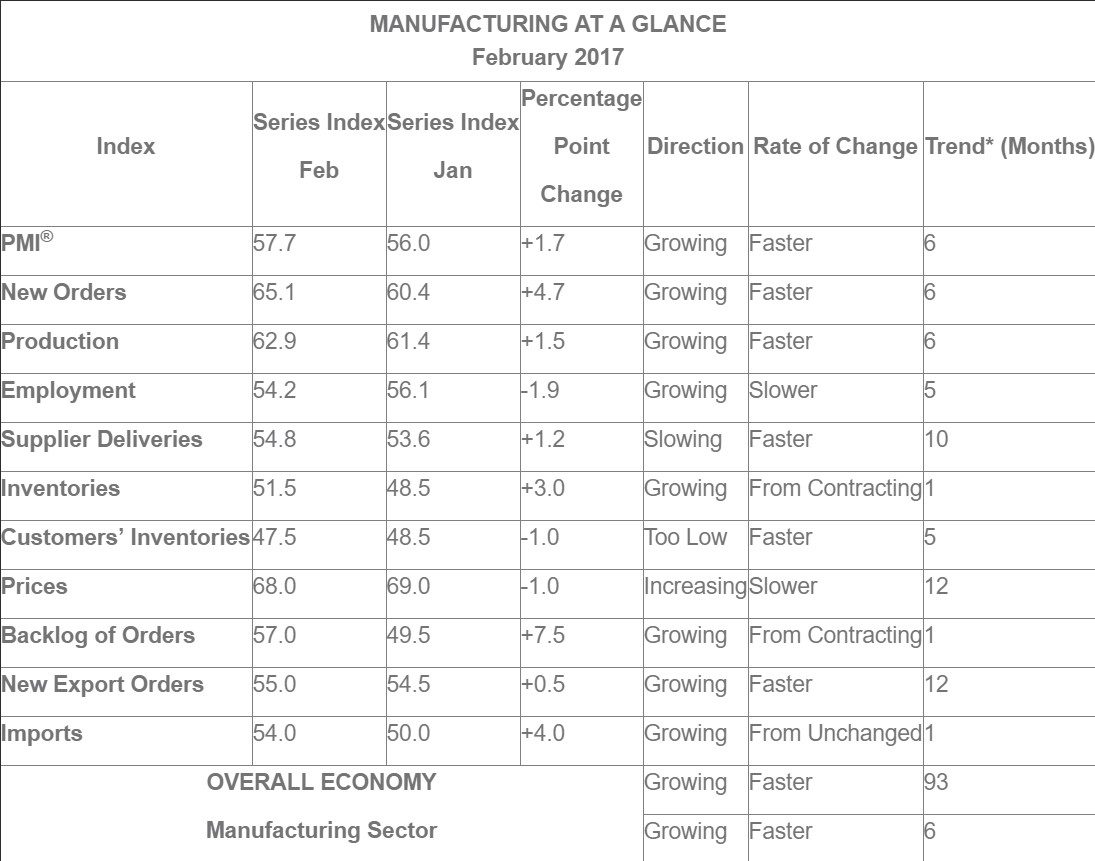
In my last article, I mentioned the main reason for the large rally on Wednesday was Trump’s speech to Congress. While the speech was important, one other reason for the rally was the spectacular ISM Manufacturing PMI report. The PMI reached 57.7 which was above expectations for 56.2 and was the highest reading since December 2014. The New Orders Index hit 65.1% which was up 4.7% from last month and was the highest reading since December 2013. The chart below shows a breakdown of the components of the PMI. As you can see, most components are accelerating which is why this is an A plus report.

This PMI reading is consistent with 4.5% GDP growth. January’s PMI was consistent with 4.0% GDP growth. If these surveys were accurate, GDP growth must be above 3.5% unless March falls off a cliff. The reality is Q1 GDP growth will not come close to 3.5% based on the current economic reports we’ve seen. The reason GDP won’t reach what the Manufacturing PMI is suggesting is because there was been a wide bifurcation between the survey data and the hard data. The chart below shows the Bloomberg surprise index for soft and hard data. The hard data is in the range it has been in this entire recovery, but the survey data is near cycle highs. The difference between the two is at cycle highs. Either the economy will have a great second half of 2017 or the surveys will start to weaken soon.


Leave A Comment