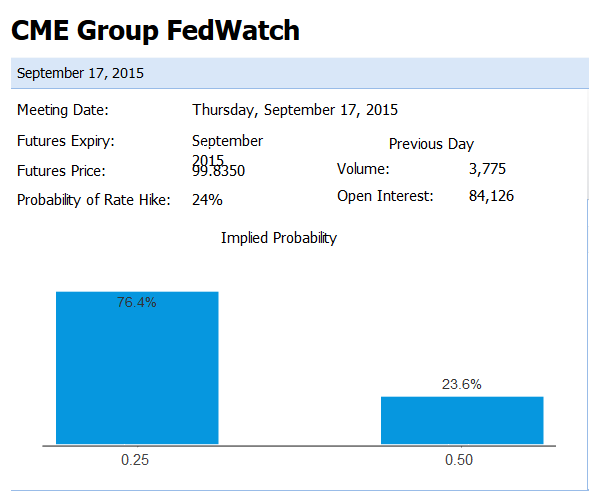
As of September 10, the CME has the odds of a September hike by the Fed at 24%. Bloomberg says the probability of a move is 28%.
Bloomberg Rate Hike Odds

CME Fedwatch Odds

Both Models Wrong
What’s wrong with both models is they still presume a quarter point hike.
Neither Bloomberg nor the CME allows for the possibility of a Fed hike to precisely 0.25% or to a smaller tighter range.
Given the effective Fed Funds Rate is 0.14% (see upper right of Bloomberg chart), resetting the rate to a flat 0.25% from the current range of 0.00-0.25% (now at 0.14%), would be both a “move” and a “hike”.
Tighter Range
The Fed could also use ranges as Bloomberg and CME imply, but target ranges in 1/8 of a point increments rather than 1/4 point increments.
For example the Fed could target a range of 0.25% to 0.375%.
I suspect the odds of a move to a flat 0.25 or a range (0.25% to 0.375%), are far greater than Bloomberg’s “probability of a move” set at a mere 28%.
I went over this before, on August 19, in Plotting the Fed’s Baby Step 1/8 Point Hikes; Yellen vs. Greenspan “Measured Pace”.
I updated my charts today.
Flattening of Rate Hike Expectations
Click on picture to enlarge

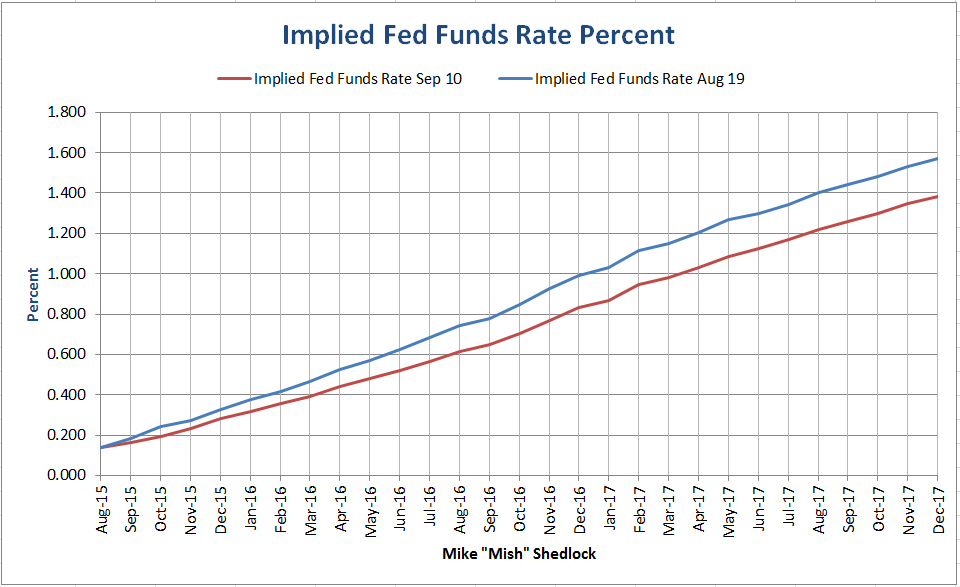
Using Fed fund futures from CME, I calculated implied interest rates through December 2017. The line in Blue shows what futures implied on August 19. The line in red is from September 10.
Note the flattening of the curve. This has been happening pretty much all year.
The market initially penned in hikes for January. The hikes then shifted to March, then June, then September, and now December by both the Bloomberg and CME models.
Range Watch
Curve Watchers Anonymous is closely watching the implied baby steps in the Fed fund futures. Incrementally, the hikes appear as follows.


Leave A Comment