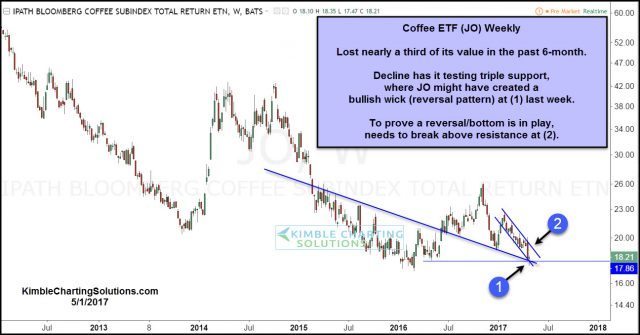
Coffee has been pretty ice cold since November of 2016, losing nearly a third of its value. Could this large 6-month decline turn into an opportunity? Below is a chart for the Coffee ETF (JO) over the past few years.

CLICK ON CHART TO ENLARGE
The decline over the past 6-months in JO, has it testing triple support last week at (1). While at this potential support zone, JO attempted to create a bullish wick (reversal pattern) last week at (1). Bullish sentiment towards coffee has declined along with the price over the past 6-months, to the 29% level.
The trend in Coffee (JO) remains down, as it has created a series of lower highs for years. One weeks reversal action does not prove that a trend reversal is in play. The first step towards proving that a trend reversal could be in play, would be an overhead breakout at (2).


Leave A Comment