With the passage of tax reform, one market segment one might believe experiences an outsized benefit to earnings is U.S small cap stocks. This certainly seems plausible due to the fact smaller companies tend to have less direct exposure to foreign revenue; therefore, likely generating most of their profits in the U.S.
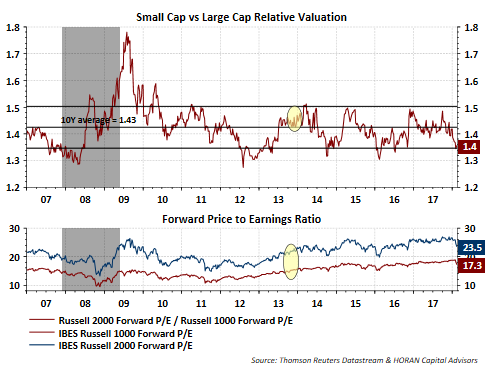
Our firm exited completely the U.S. small cap space in late 2013 based on a number of factors, with one being the relative valuation of small cap stocks versus large cap stocks. Reviewing the relative valuation of small caps versus large caps based on price earnings ratios has certainly tended to favor small over large as can be seen in the chart below.

Looking at the relative valuation alone does not explain the entire story though. The chart below shows the expected forward earnings growth rate for both large cap (Russell 1000 Index) and smallcap (Russell 2000 Index) stocks. Noteworthy though is the fact the one year forward earnings growth rate for large cap stocks is slightly greater than small cap stocks, 19.4% versus 19.3%, respectively.

Comparing the earnings growth rate above and the P/E in the bottom half of the first chart in this post one can evaluate the PEG ratio, i.e. the P/E to earnings growth rate. For large cap stocks the current PEG ratio is .9 and for small cap stocks the PEG ratio equals 1.2. For companies and/or indexes that are trading at PEGs less than 1.0, this indicates in this case that the index is undervalued since the valuation is lower than the underlying earnings growth rate. I have written a number of posts on the PEG ratio and highlight one, A Look At The PEG Ratio: Earnings Growth Versus Valuation, for readers interested in more information on this topic.
In spite of large cap outperformance over the last four years, on a longer term basis or ten year time period anyway, large cap returns have just recently surpassed the return of small company stocks as displayed in the top portion of the below chart. And although small cap stocks are trading at a relative valuation versus large cap that is in the lower end of its historical range, and the fact small caps have significantly underperformed large cap stocks since 2013 as can be seen in the bottom half of the below chart, large cap stocks continue to appear more attractive based on valuation and earnings growth expectations.


Leave A Comment