
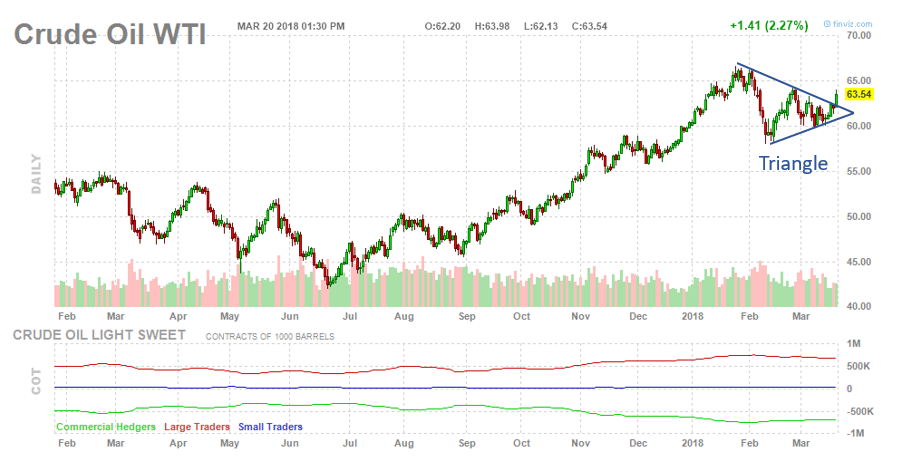
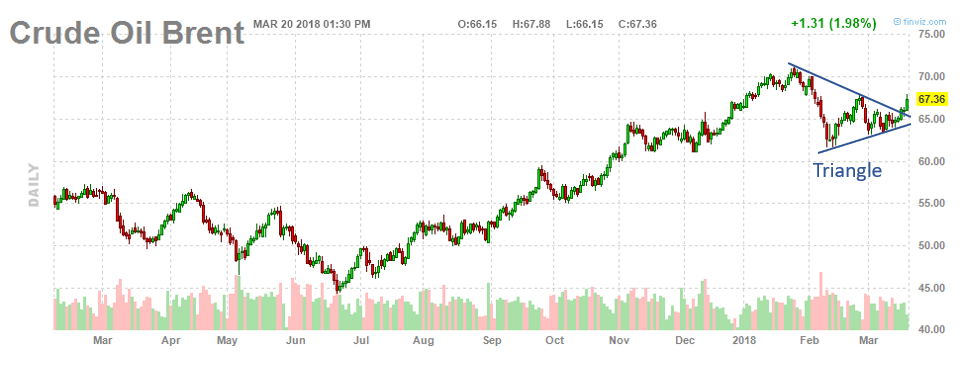
For the past several weeks, I’ve been watching triangle patterns form in crude oil after its slide in early-February. Breakouts from triangle patterns often lead to important directional moves, which is why I believe it is worthwhile to pay attention to these formations. Both WTI and Brent crude oil finally broke out of their triangle patterns today due to Middle East tensions and speculation regarding more cuts in Venezuelan output.
Here’s West Texas Intermediate crude oil’s breakout:
Here’s Brent crude oil’s breakout:
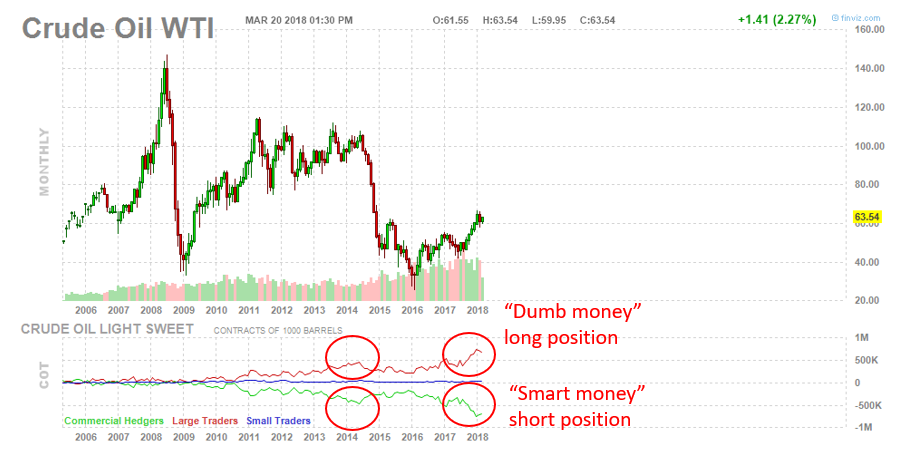
While I believe in respecting price trends instead of fighting them, I’m still concerned about the fact that crude oil’s rally of the past two years has been driven by “dumb money” or large speculators, who are more aggressively positioned than they were in the spring of 2014 before the oil crash. At the same time, the “smart money” or commercial hedgers have built their largest short position in history.
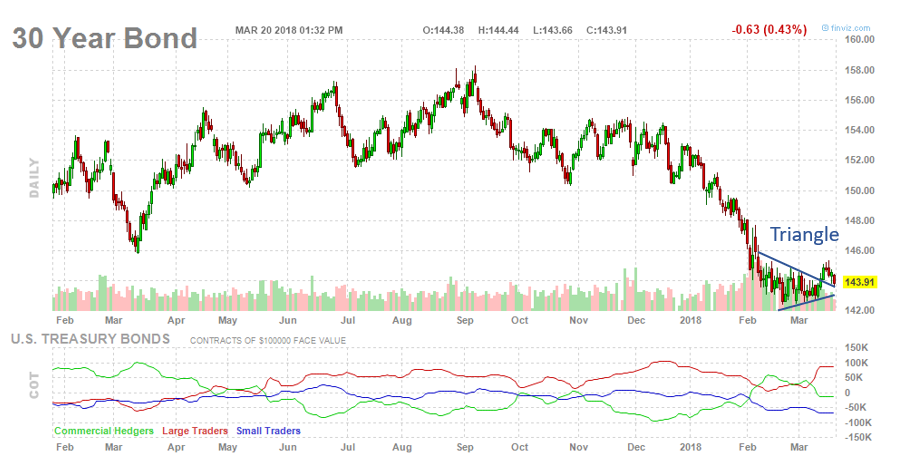
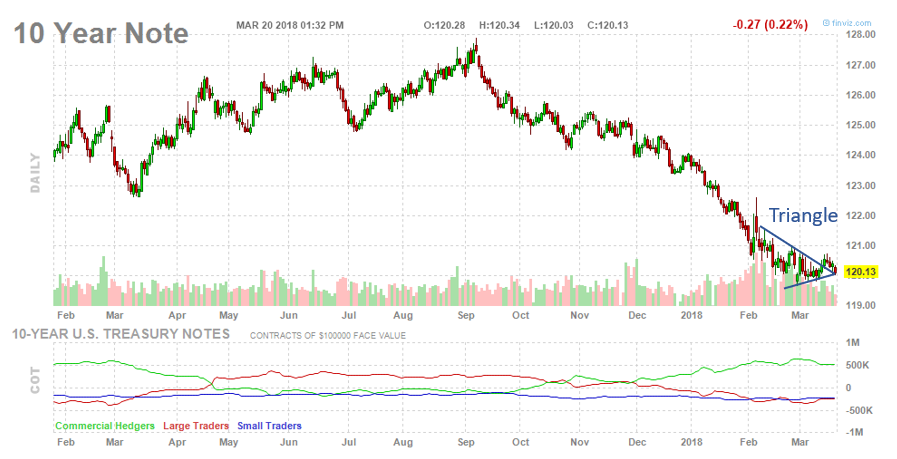
Last week, I showed that U.S. Treasuries had broken out of triangle patterns of their own. Crude oil’s recent bullish move has been threatening the Treasury breakout (the two markets trade inversely):
The U.S. Dollar Index is worth paying attention to when analyzing the crude oil market. Bullish moves in the dollar are typically bearish for crude oil and other commodities, and vice versa. Today’s bullish crude oil move and breakout is not confirmed by the U.S. Dollar Index, which is up .64 percent today. The U.S. Dollar Index has been trading in a directionless manner for the past two months, but its next major trend is likely to affect crude oil. If the Dollar Index can break above its trading range and downtrend line, it would likely lead to further bullish action (which would hurt crude oil). If the Dollar Index breaks down from its trading range, however, it would likely lead to further bearish action (which would push crude oil higher).


Leave A Comment