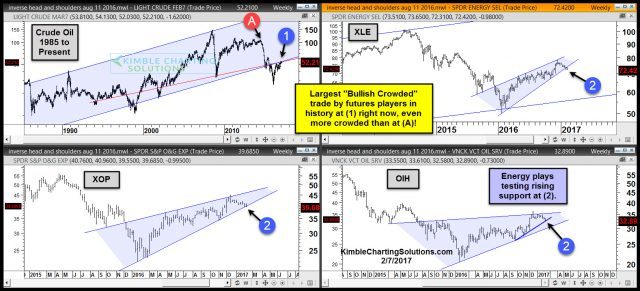
In the summer of 2014, when Crude Oil was trading near $106 per barrel, traders amassed the largest bullish crowded trade in history. After the crowd turned big time bullish Crude Oil, it started falling in price and Crude underwent a history decline, losing over two-thirds of its value in less than 2-years.
Currently the Crude trade now reflects MORE bulls than back in 2014. Is sentiment alone enough to make a decision of what to do with this sector? I humbly don’t think so. Below looks at Crude Oil and three other energy ETF’s and how they look from a Power of the Pattern perspective.

Crude Oil chart in the upper left reflects that Crude Oil is attempting to climb back into its long-term rising channel at (1). If it does break back into its 30-yea rising channel, it would send a positive risk on message. Traders that are long Crude Oil want/need to see a breakout at (1).
With the most crowded bullish trade in history in play right now at (1), the last thing holders of the long Crude positions would want to see is weakness start taking place at (1)!
At the same time Crude is testing important overhead resistance, XLE, XOP and OIH are testing short-term rising support levels at each (2).
Crude Oil and the broad market do NOT always correlate, even though they have the past couple of years.
With so many traders owning long Crude Positions, what takes place at (1) above, could become a very price point to see if they are on the right side of this trade.


Leave A Comment