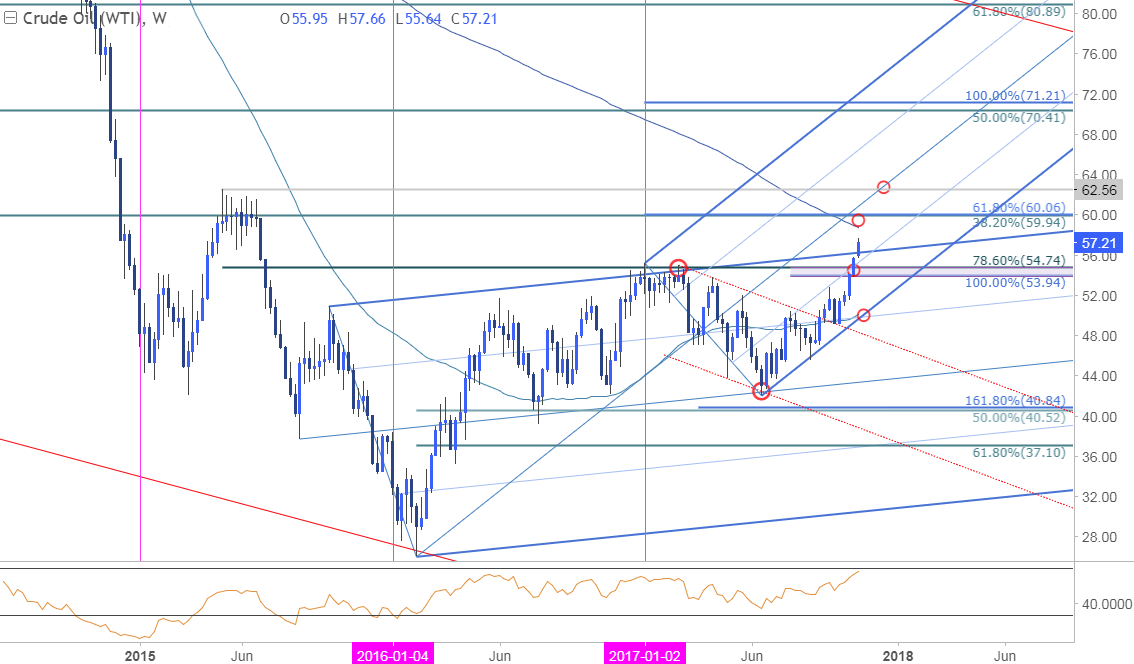
Crude Weekly Chart

Technical Outlook: I highlighted this chart in last week’s Technical Perspective and the rally & subsequent close above the 53.94/54.75 resistance zone keeps the focus higher in crude. From here, the risk for near-term exhaustion surmounts on a rally into critical resistance at 59/60– a region defined by the 200-week moving average, the 38.2% retracement of the 2011 decline and the 61.8% extension of the 2016 advance. Weekly support now rests at 53.94 with broader bullish invalidation steady at the 50-handle where the 52-week moving average converges on the lower median-line parallel.
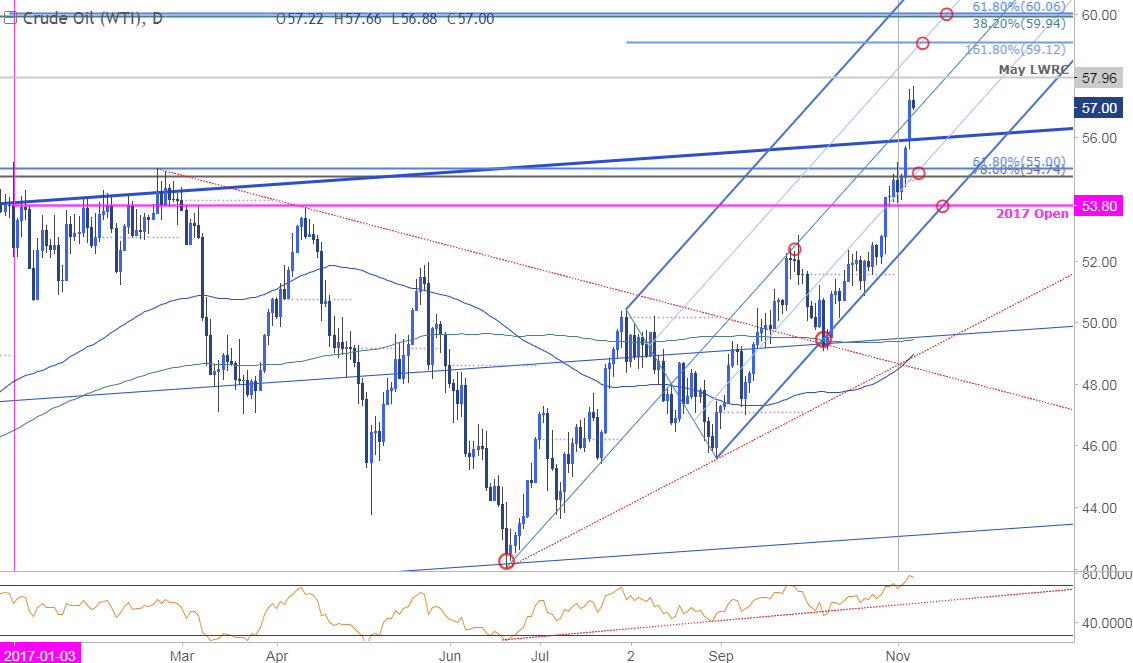
Crude Daily Chart

A look at the daily chart sees prices trading within the confines of a near-term ascending pitchfork extending off the yearly lows- we’ve been tracking this formation since last month. The 50-line further highlights near-term support at 54.74-55 with the yearly open at 53.80 marking our near-term bullish invalidation level. Initial resistance eyed at the May low-week reversal close at 57.96 backed by 59.12 & the 60-handle- both areas of interest for possible near-term exhaustion / short-entries.
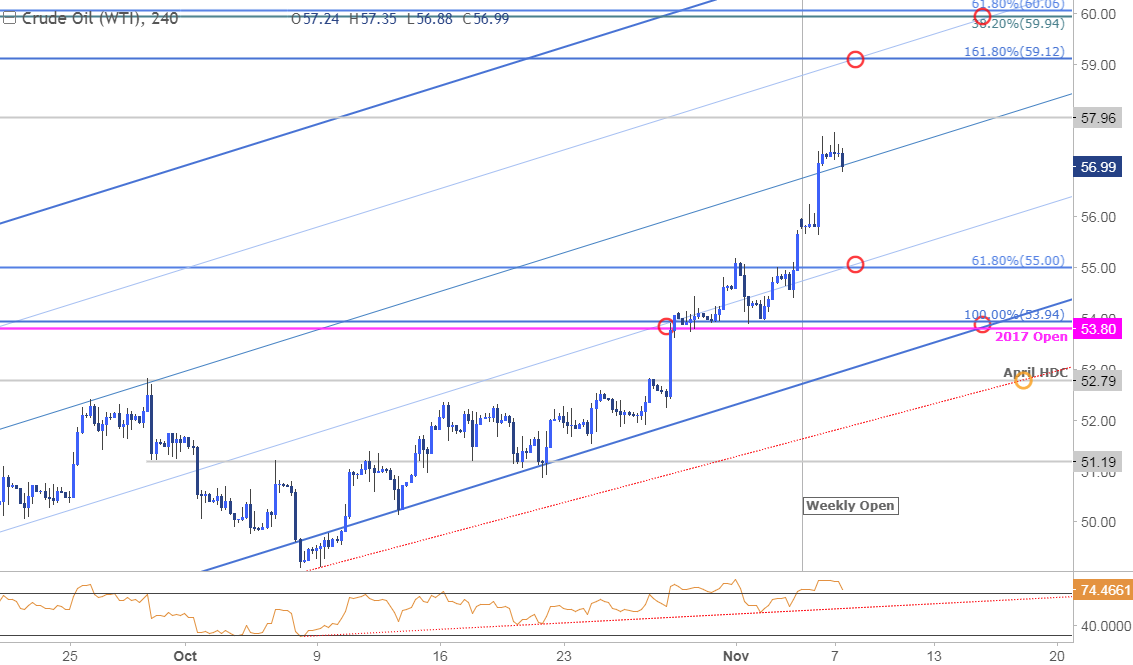
Crude 240min Chart

Notes: Near-term price action has prices testing median-line support here and if we break lower, look for the pullback to offer favorable long-entries while above 55 targeting subsequent resistance objectives into the upper 50-line. Keep in mind that momentum remains in overbought territory on both the daily & intraday timeframes. Bottom line: the immediate risk is for exhaustion on a drift higher into the upper resistance targets but ultimately a lager pullback would offer more favorable long-entries while with in this formation.


Leave A Comment