Gold prices declined as the US Dollar rose alongside front-end Treasury bond yields, tarnishing the relative appeal of non-interest-bearing and anti-fiat assets. That seemed to reflect an upshift in the pace of expected Fed interest rate hikes. Markets are still leaning toward two hikes in 2018 but rate futures imply they are now seen happening earlier in the year than previously.
Looking ahead, a quiet offering on the data docket puts risk trends in focus. S&P 500 futures are pointing lower, hinting at a risk-off day ahead. That might help gold recover some lost ground as capital flows into the safety of government bonds and pressures yields downward. The past two days have produced about-face sentiment reversals intraday, however, so traders would be wise to proceed with caution.
Crude oil prices marked time, seemingly unimpressed by an API report that said US inventories shed 5.48 million barrels last week. The analogous set of official EIA statistics is now in focus, where economists expect to see a more modest 2.68 million barrel outflow. A larger drop echoing the API print may nudge prices higher, but yesterday’s price action warns against betting on follow-through.
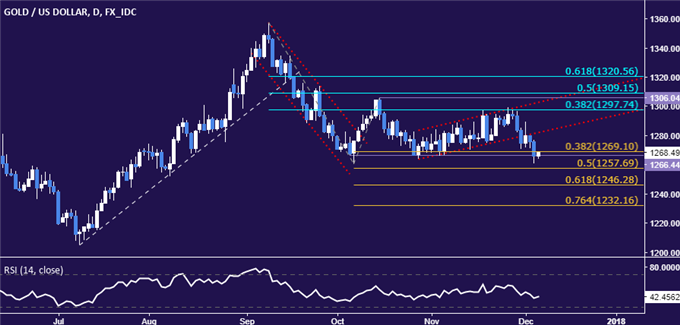
Gold Technical Analysis – Gold prices narrowly breached support in the 1266.44-69.10 area (October 6 low, 38.2% Fibonacci expansion), seemingly opening the door for a test of the 50% level at 1257.69. Alternatively, a daily close back above 1269.10 sees the next upside barrier marked by channel floor support-turned-resistance at 1282.70.

Chart created using TradingView
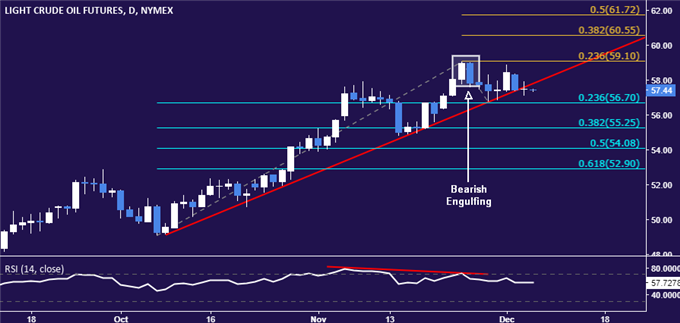
Crude Oil Technical Analysis – Crude oil prices continue to oscillate in a choppy range around the $58/bbl figure. A daily close below the 23.6% Fibonacci retracement at 56.70 targets the 38.2% level at 55.25 next. Alternatively, a breach of the 23.6% Fib expansion at 59.10 targets the 38.2% threshold at 60.55.

Chart created using TradingView


Leave A Comment