T. Rowe Price Group (TROW) was founded in 1937. Today, the company has a market cap of $16.3 billion and manages over $700 billion in assets.
The company provides mutual funds, advisory services, and separately managed accounts for individuals, institutional investors, retirement plans, and financial intermediaries.
T. Rowe Price Group is one of only asset management companies in the Dividend Aristocrats index. The other is Franklin Resources (BEN).
This article analyzes T. Rowe Price Group’s dividend, competitive advantage, total return potential, valuation, and recession performance in the sections below…
Dividend Analysis
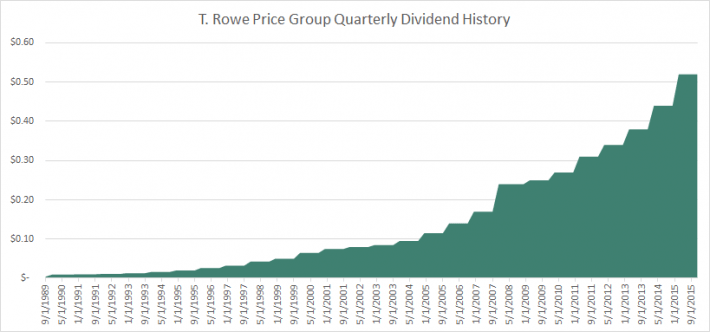
T. Rowe Price Group has paid increasing dividends for 29 consecutive years. The company’s latest dividend increase (in February of 2015) was for 18.2%.
The image below shows T. Rowe Price Group’s dividend history since 1989:

This dividend history does not include special dividends. In 2015, T. Rowe Price Group paid a special dividend of $2.00 per share. This move highlights the shareholder friendly nature of T. Rowe Price Group’s management.
T. Rowe Price Group currently has a dividend yield of 3.2% and a payout ratio of 46%. The company’s above average yield and fairly conservative payout ratio bode well for both current income and potential future dividend increases.
The company’s historical dividend yield is shown in the image below:

As you can see, now is historically the best time to buy T. Rowe Price Group stock (based on its dividend yield) since the Great Recession. T. Rowe Price Group stock has only traded for a dividend yield above 3% in the early nineties, briefly in 2002, and during the Great Recession.
Competitive Advantage
T. Rowe’s competitive advantage comes from its trusted name in the mutual fund industry. The company generates the majority of its earnings from mutual fund fees.
As a result, outperformance compared to its peers is critical for the company to continue marketing its mutual funds.


Leave A Comment