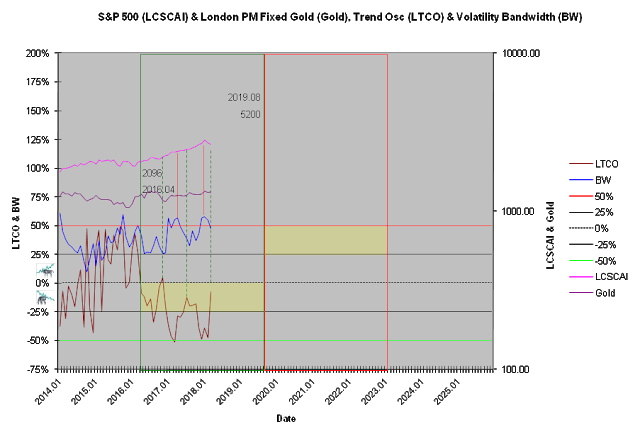
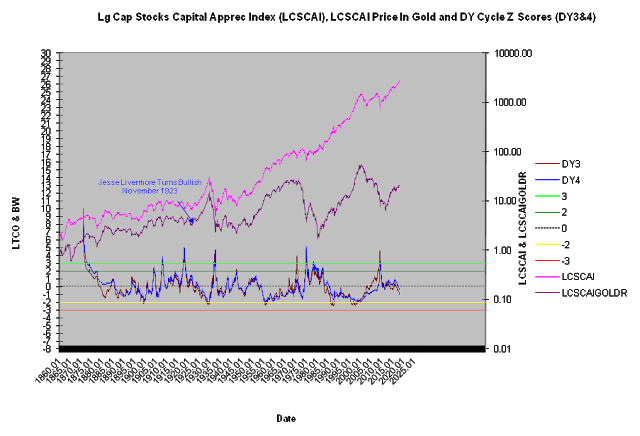
Those that view the message of the market on a daily basis are likely confused by trading noise. While trading noise contributes to the long-term trends, it does not define them. Human behavior tries to explain trading noise as a meaningful trend. This confuses the majority which, in turn, contributes to their role as bagholders of trend transitions.
The Dividend Yield’s overall trend, revealed by trends of price, leverage, and time, are defined in the The Matrix for subscribers.
Subscriber Comments
‘Fundamentals’, over cited valuation metrics such as PE, Price to Sales, Book Value, and so on, are relatively poor timing tools for investors. We accept them because few investors have the skill to test their assumptions, and if they do, they rarely test past 1990.
The dividend yield cycle, a composite cycle defined by direction (LTCO) and concentration (DY1-4), defines the long-term trend for US stocks. A negative dividend yield trend oscillator (LTCO) and neutral long term cycle concentrations (DY3 and DY4) define a bullish long-term trend that’s only relieving DY1 and DY2’s bearish cycle readings generated in February. Major stock market tops, inflection points few Wall Street analysts have the skill to recognize, display DY3 and DY4 concentrations near or below -2. Cycle concentrations measure energy flows.
Recognition is not complicated for those with the proper tools. The market is slowly approaching a buying opportunity, similar to 1926, 1928, and early 1929.
All trends are tracked in the LT Cycle Trend of the Matrix.
Chart 1: Direction (LTCO) 1921-1932

Chart 2: Direction (LTCO) 2014-2025

Chart 3: Concentration (DY1 & DY2)

Chart 4: Concentration (DY3 & DY4)


Leave A Comment