Video length: 00:21:14
Regardless of the market you trade, chances are it has been severely affected by the wild ride in the US 10Yr. Treasury Yield in recent weeks. The positive correlation in the UST 10Yr Yield is rather significant whether you look at USD/JPY, Crude Oil, or major equity indices like the German Dax. The inverse correlation, meaning a move lower in the 10yr correlates to a move higher in the dependent asset, has recently hit a high mark in Gold.
As you can imagine, the yield moves lower (as the price moves higher) much like USD/JPY when there is a rush for money into haven assets. What’s important to note is that much of the ~100% rise in the yield, which aligned with the rise in markets, commodities, and some currency pairs were predicated on the back of the Trump effect leading to high growth and inflation. The prevailing market theme was that this inflation would induce pressure on the Federal Reserve to possible hike rates more aggressively than originally forecasted.
Much of the weakness in yields that has also brought down the USD is the weak US data on Friday with a soft CPI & Retail Sales (ex-Auto).
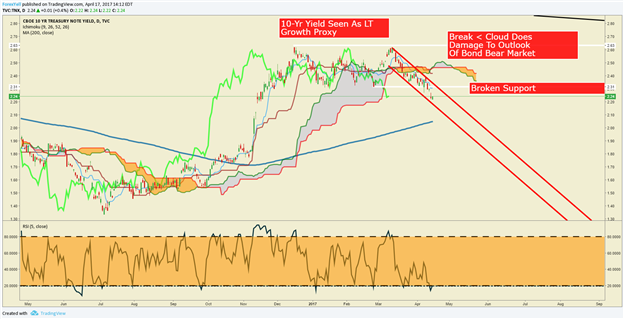
As you can see on the chart below, it appears that a breakdown could be developing in the 10-yr yield that could take us down back toward 2% or possible toward 1.50% where we bottomed last summer. The correlations would favor that lower yields would bring about a weaker dollar, which could boost some commodities
Closing Bell’s Top Chart: April 17, 2017: TNX (US Treasury Ten–Year Yield)

Today’s Main Event:
Bilateral Trade framework and economic dialogue guided by US Vice President Mike Pence and Japanese Deputy Prime Minister Taro Aso, scheduled for Apr 18 is Tuesday’s top event. The risk of further JPY appreciation is mainly on whether the topic of conversation turns to overly weak JPY and BoJ monetary policy stance. VP Pence unlikely to spark confrontation in the first meeting.


Leave A Comment