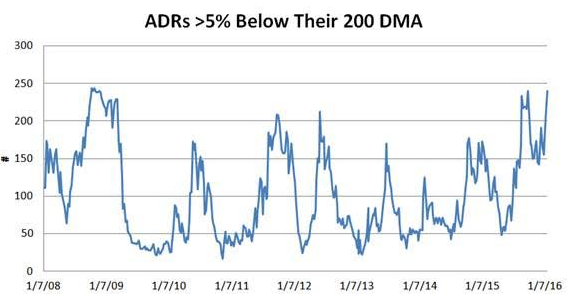
The average ADR score is 37.13 and remains below 40 (scores ticked up slightly this week). Typically, scores below 40 coincide with short-term market bottoms. The average ADR in our universe is -36.07% below its 52 week high, -15.15% below its 200 dma, has 3.65 days to cover held short, and is expected to grow EPS by 9.68% in the coming year.
To gauge market sentiment and determine if risk/reward is shifting to favor buyers, we’ve also found it helpful to consider the number of ADRs that are trading more than 5% below their 200 dma. Historically, when this reading gets to these levels it has corresponded (roughly) with an attractive entry point.

The following table includes the highest and lowest scoring ADRs in our universe.

The best sector across ADRs is healthcare (TEVA, GWPH, NVO, MR, LUX, GLPG). Services (VLRS, ICLR, HMIN, EDU, SFL, NCTY, CTRP) and technology (NTES, SPIL, WUBA, TSM, NTT, CMCM, ATHM) also score above average. Industrial goods and utilities score in line. Consumer goods, basics, and financials score below average.

The best zones are Africa (DRD, HMY) and No. America (BMO). Sub-Saharan Africa, No. America, and MENA (TEVA) are the top regions. Hong Kong (SMI, OIIM), Bermuda (SFL), So. Africa (DRD, HMY), Taiwan (SPIL, TSM), and Ireland (ICLR, RYAAY) are the strongest scoring countries.


Leave A Comment