Yesterday we saw a pretty sell-off in Crude oil. Today the inventories number came in, one day later due to Tuesday’s holiday. I do not need to write much about the inventories as a picture can tell you more than a hundred words:

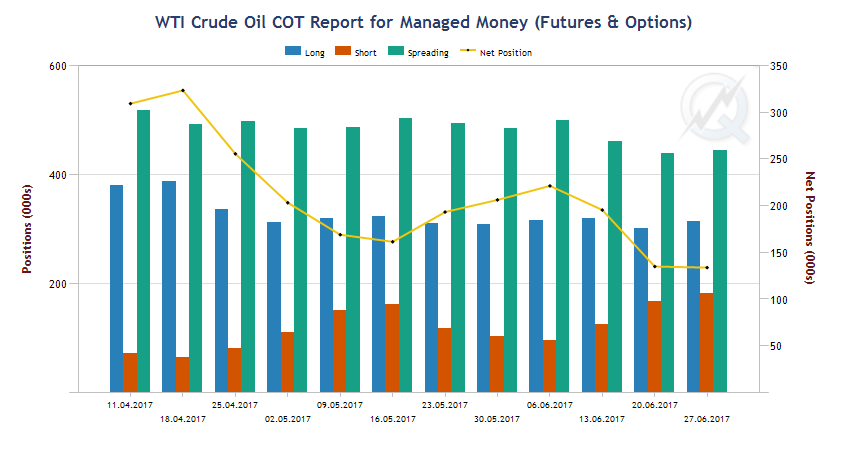
We will take a look at the COT data with Quickstrike which is available on the CME Group’s website. Looking at this graphic, we can observe an increase in the managed money short positions. Actually, I do not give any attention to the inventories or the COT numbers in my analysis but I thought it would look good in this post.

One thing to point out from today’s particular session is the timing. More specific: the timing of the inventories. Looking at the VWAP chart, we can observe the inside of the ETH value area.
The conclusion would be a rotational/balanced behavior, especially after the heavy sell-off from yesterday as well. With that been said, take a look at where the market sailed when the inventory number came in. Yes, at the VAH close level extreme. It made sense to short the market and to conclude a potential rotation to the other extreme.

Now let’s move forward to the daily volume profiles. Here, I want to point out the two distributions and the rotation between their VPOC. The upper distributions VPOC was confluent with the mentioned VWAP VAH close level. That should be enough market generated information for a short trade in my humble opinion.


Leave A Comment