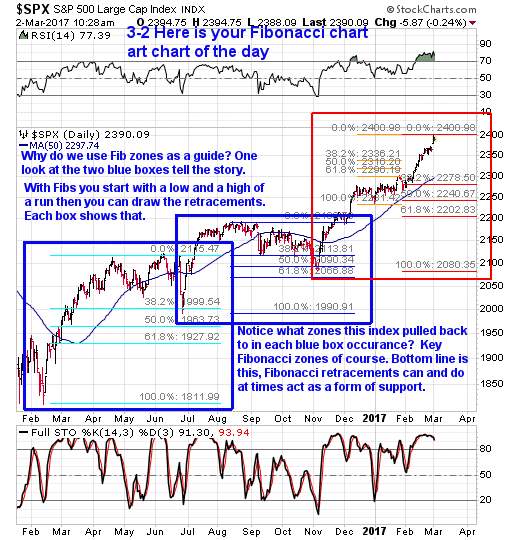
Why do we use Fibonacci retracements at times and so should you?
Because as you’ll see below they tend to act as support zones much like trendlines and moving averages do. We’ve seen it time and time again and the chart below shows this to be true.

Now that we’ve keyed in on the blue boxes and chart notes in the chart above lets talk about the red box.
Within that red box we see multiple Fibonacci retracements shown. Remember when applying Fibonacci retracements you need a markable high and markable low as your reference points.
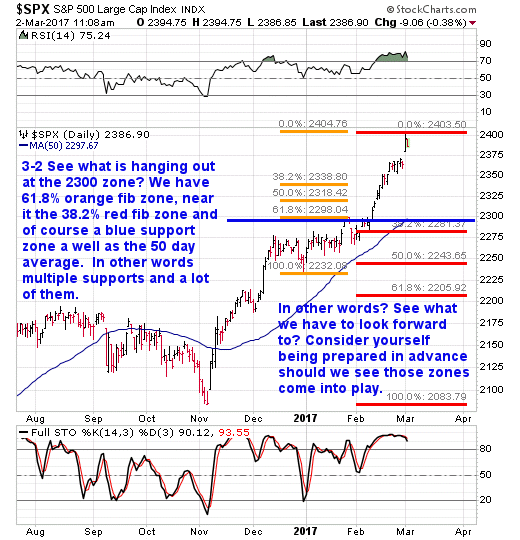
In the chart below what I’ve done is zoomed in on the red box from the chart above.

If yesterday’s high is a markable high for the time being, then we can apply retracements as a guide to see based upon where Leonardo De Pisa (founder of Fibonacci) sees support zones.
Notice what is hanging out in the 2300 zone? If you said support you are correct. So at that level not only do we have classic technical analysis chart supports via trend lines and the 50 day we also have a Fibonacci cluster to give us a clue as to a pretty serious support zone to be aware of in the future. Like I’ve said, one always wants to know where support zones are in advance.


Leave A Comment