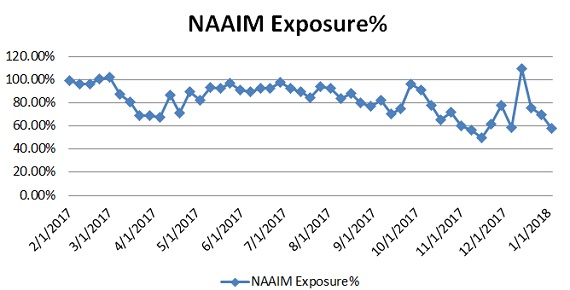
The National Association of Active Investment Managers (NAAIM) Exposure Index represents the average exposure to US Equity markets reported by NAAIM members. The blue bars depict a two-week moving average of the NAAIM managers’ responses. As the name indicates, the NAAIM Exposure Index provides insight into the actual adjustments active risk managers have made to client accounts over the past two weeks. The current survey result is for the week ending 01/03/2018. Fourth-quarter NAAIM exposure index averaged 75.13%. Last week the NAAIM exposure index was 69.39 %, and the current week’s exposure is at 57.95%.
Recently we have been noting “… money managers suddenly decided to cash in equities to take profits at the current elevated price levels… U.S. stock-market traders pulled an estimated $17.47 billion from U.S.-based stock funds over this past week, the highest weekly outflow since September 2015 …Money managers continued selling off equities to stash funds to bid on equities to start the New Year…” Professional investors further cashed in stocks even as the market attained records highs on lighter than normal trading volume. Investors are stashing funds to bid on stocks ahead of the upcoming quarterly earnings announcements.


Leave A Comment