According to Jeff Hirsch in a recent issue of the Almanac Trader, May has been a tricky month over the years, with a well-deserved reputation following the May 6, 2010 “flash crash”. It used to be part of what we called the “May/June disaster area.”
From 1965 to 1984 the S&P 500 was down during May fifteen out of twenty times. Then from 1985 through 1997 May was the best month, gaining ground every single year (13 straight gains) on the S&P, up 3.3% on average with the DJIA falling once and two NASDAQ losses. In the years since 1997, May’s performance has been erratic; DJIA up nine times in the past nineteen years (three of the years had gains in excess of 4%). NASDAQ suffered five May losses in a row from 1998-2001, down – 11.9% in 2000, followed by ten sizable gains in excess of 2.5% and four losses, the worst of which was 8.3% in 2010.
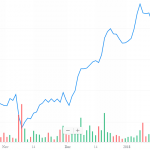
Post-election-year Mays rank at or near the top. May is the top performing NASDAQ and Russell 2000 month in post-election years. The Russell 2000 has been up 9 straight with gains averaging a whopping 4.6%. DJIA and S&P 500 (since 1953) have been nearly as strong, with May ranking 4th and 3rdrespectively. In the 2nd quarter-to-date graph below investors are picking up the pace of trading “risk-on”. Investors are still holding on to gold to hedge against uncertainty, but you can see the Nasdaq index is the leader and the other indices are coming on strong.
A tool to help confirm the overall market trend is the Bullish Percent Index (BPI). The Bullish Index is a popular market “breadth” indicator used to gauge the internal strength/weakness of the market. Like many of the technical market internal indicators, it is used both to confirm a move in the market and as a non-confirmation and therefore divergence indication.
Nasdaq stocks have been leading the market direction for the past year. Last week we noted:
“…the $BPCOMPQ is beginning a recovery bounce. We are looking to see the index moves above its 200-day moving average at approx. 62 to signal a break higher out its current trading range. There is a lot of overhead resistance, but as mentioned above the Nasdaq has been the market leader and if it breaks out the other major indexes can be expected follow…”


Leave A Comment