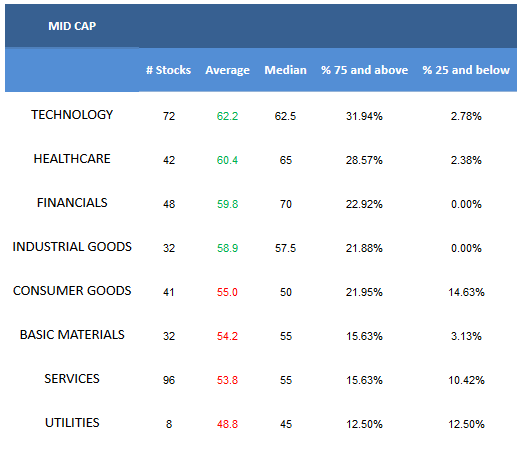
The average mid cap score in our universe is 57.48. Over the past four weeks, mid cap scores have averaged 61.84. The average mid cap stock in our universe is trading -17% below its 52 week high, 3.87% above its 200 dma, has 6.9 days to cover held short, and is forecast to grow EPS by 14.4% next year.
Technology, healthcare, financials, and industrials score above average. Consumer goods, basic materials, services, and utilities score below average.
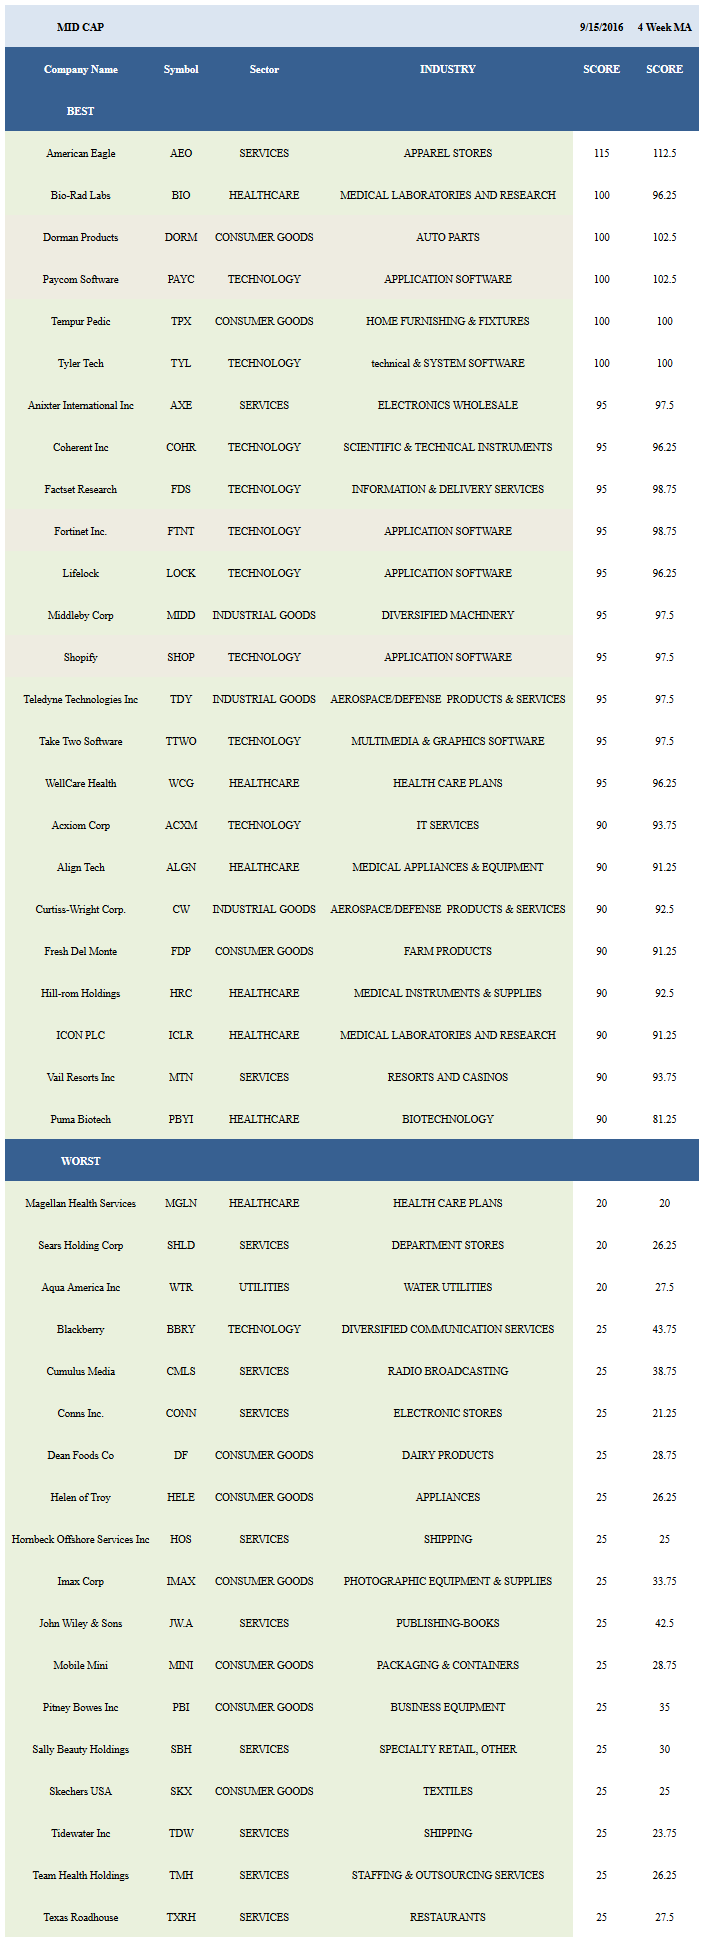
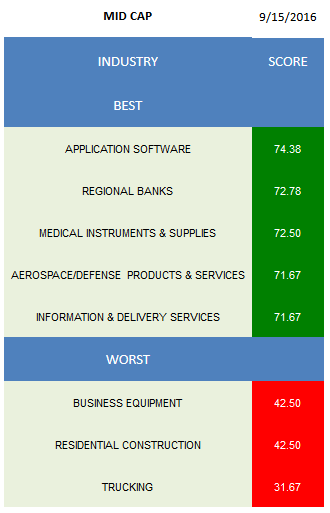
The following are the top and bottom scoring stocks in mid cap.
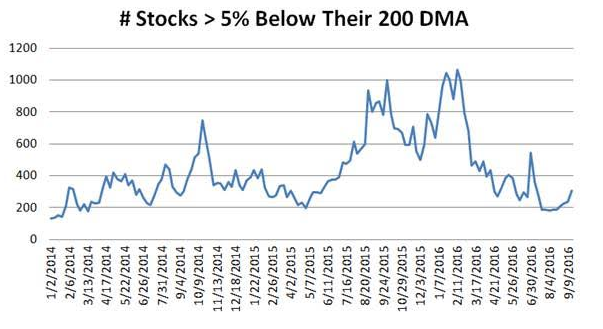
The next chart shows how many stocks in our universe are trading greater than 5% below their 200 dma. Historically, when we get to these levels, markets risk increases.
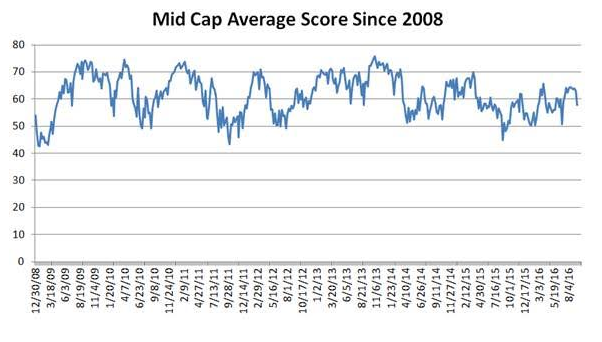
The next chart shows historical mid cap average score over time.
Application software (HUBS, PAYC, SHOP, LOCK, FTNT) is the top scoring mid cap industry. Regional banks (HBHC, FFIN, BXS, ASB), medical instruments (HRC, WST, TFX, DXCM), aerospace/defense (TDY, CW, CAE), and information & delivery services (FDS) are also high scoring.
In basics, only industrial metals/minerals (TAHO, ATI) score above average. Auto parts (DORM, FDML, CLC) is the only above average scoring group in consumer goods. Regional banks, accident & health insurance (AFL), and investment brokers (MKTX) are best in financials. The top healthcare industries are medical instruments and medical appliances (ALGN, MASI). Focus on aerospace/defense and industrial electrical (AOS) in industrials. Concentrate on business services (MMS, RBA), auto dealers (PAG), and restaurants (EAT, CBRL) in services. Application software, information & delivery services, and technical & system software (TYL, MENT) score best in technology. Gas utilities (EGN) can also be bought.


Leave A Comment