<< Read More Moving Averages In Extended Market Climates Part Two – The Countdown Clock
<< Read More: Moving Averages In Extended Market Climates
For starters lets pick up with the chart we left off with the other day.

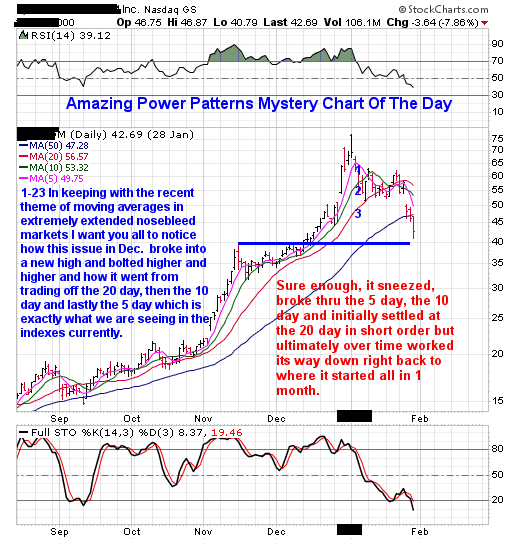
In the chart above we walked thru what I call the countdown clock when it came to moving averages in extended market climates and what it leads to once there are no more moving averages to trade off of. 1-27-18 As I write this our indexes are currently above the 5 day moving average. Its only a matter of time before it burns itself out to the upside much like our mystery chart did as shown above.
As you can see after its initial break to the downside once the moving average countdown clock went to zero, initially it blew thru all the moving averages I mentioned the other day. While it even broke the 50 day average it did end up stalling out at a prior side to side support as shown in blue and that is why I always am drawing support lines for you. In the process it went from $75 to $40 in about one month’s time. If that doesn’t wake you up to the dangers of chasing stocks out of FOMO in extended issues and market climates I don’t know what does. Consider this what I like to call the 1st shot across the bow to the downside.
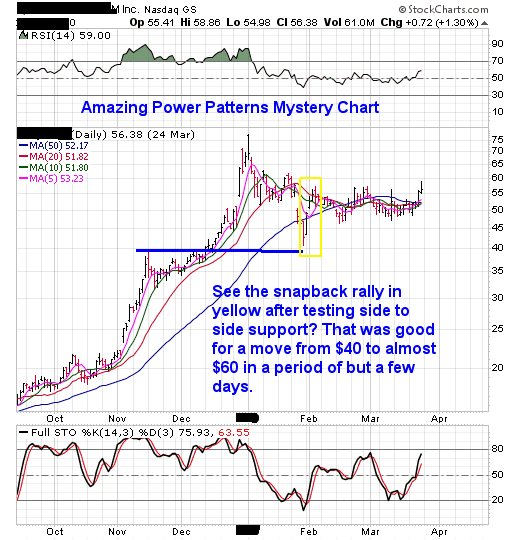
But this is where it gets interesting.After tagging a side to side support zone here too came the famous snap back rally that took it from $40 to almost $60 in like 4 days at the beginning of Feb.

A key point here is just because a stock has been selling off does not mean you chase it on the short side because that snap back rally from $40 to almost $60ended up ripping ones face off in the process had they chased a bus on the short side of the market.
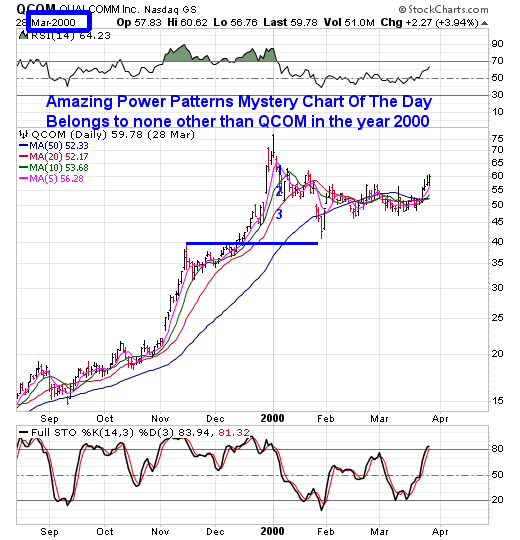
As for our mystery chart of the day and who is it?
Its one of the biggest and baddest names of the party like its 1999 dotcom bull market cycle.

Moving on you can see the dust settled and the stock one could say went thru a period of base building or even one could say the bottom of a cup for almost two months.


Leave A Comment