This was an especially dramatic day for the market. Before the US markets opened, global equities were in a rout. The Shanghai Composite had dropped 3.51% for the day and the Euro STOXX 50 would subsequently post a 2.37% loss. Also before the opening bell, investors learned that December Retail Sales and Industrial Production were both ugly, much worse than forecast, and Empire State Manufacturing showed a savage December contraction. The S&P 500 plunged at the open and sold off to its -3.33% intraday low during the lunch hour. It struggled higher during the afternoon to a trimmed loss of 2.16%. The 500 is now back in correction territory, down 8.01% year-to-date and 11.76 from its record close last May.
The yield on the 10-year note closed at 2.03%, down 7 basis points from the previous close and 24 bps off its 2015 close.
Here is a snapshot of past five sessions.

Here is a daily chart of the SPY ETF, which gives a better sense of investor participation, especially on an options expiration Friday. Volume was 133% above its 50-day moving average.

A Perspective on Drawdowns
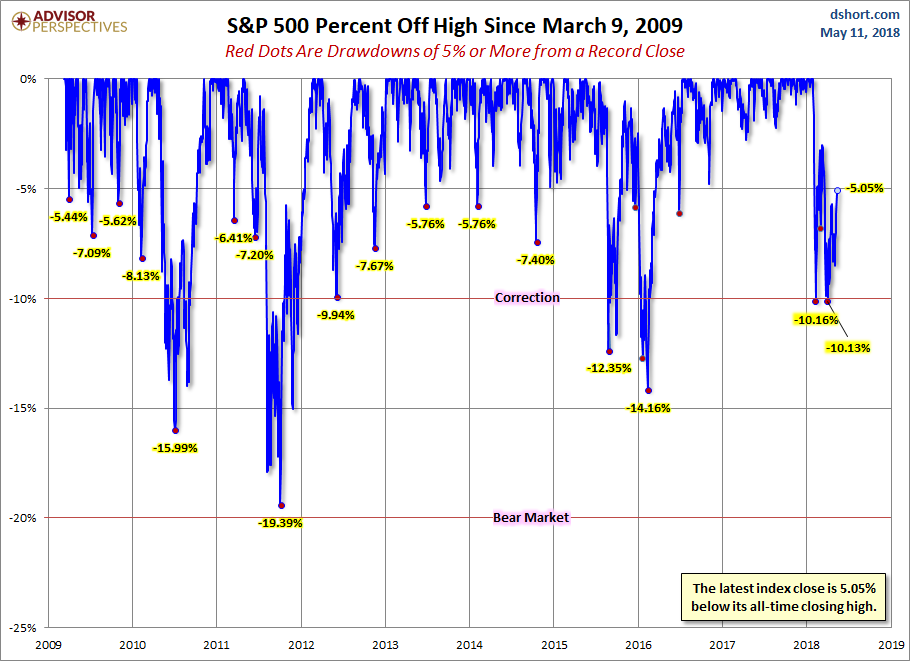
Here’s a snapshot of selloffs since the 2009 trough.

For a longer-term perspective, here is a log-scale chart base on daily closes since the all-time high prior to the Great Recession.

Here is the same chart with the 50- and 200-day moving averages. The 50 crossed below the 200 on August 28th.


Leave A Comment