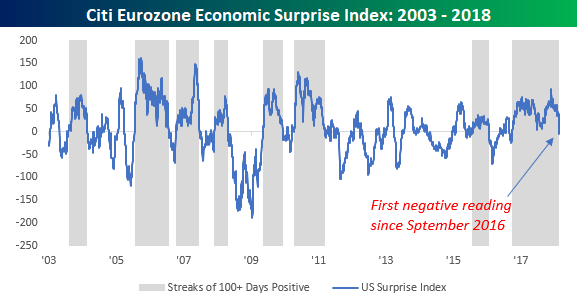
It was a disappointing week on the data front over in Europe. With almost across the board weakness in PMI indices, the Citi Economic Surprise Index for the region plummetted from over 20 earlier in the week to below zero on Wednesday. While the Citi Surprise indices tend to oscillate between positive and negative levels as expectations tend to get too positive when the data is good and too negative when the data is weak, the most recent dip into negative territory is notable due to the fact that it ended a streak of 358 straight days of positive readings. That’s right, the last time this indicator had a negative reading was in September 2016!
The chart below shows the historical readings of the Citi Economic Surprise Index for the European region with periods where the index was in positive territory shaded in gray. While streaks longer than 100 trading days going back to 2003 aren’t necessarily uncommon, the length of the most recent streak was by far the longest on record, exceeding the next longest streak (ending in July 2006) by nearly 100 trading days. So, the fact that recent data was disappointing shouldn’t necessarily come as a surprise, but the fact that it has been so long since we last saw data disappointing to the current degree, makes it feel all the more uncommon.

While economic data is starting to disappoint to the downside, data in the US continues to trend ahead of expectations. In fact, just this week, the Citi Economic Surprise Index for the US was positive for its 100th straight trading day. Going back to 2003, this current streak is just the sixth time that the US Surprise index has been positive for 100 or more trading days compared to eight for Europe. Another difference between the trends in the European and US surprise indices is that streaks of positive readings have been more prolonged in Europe than the US. Whereas there have been five positive streaks that lasted more than 150 trading days in Europe, just one in the US has lasted that long.


Leave A Comment