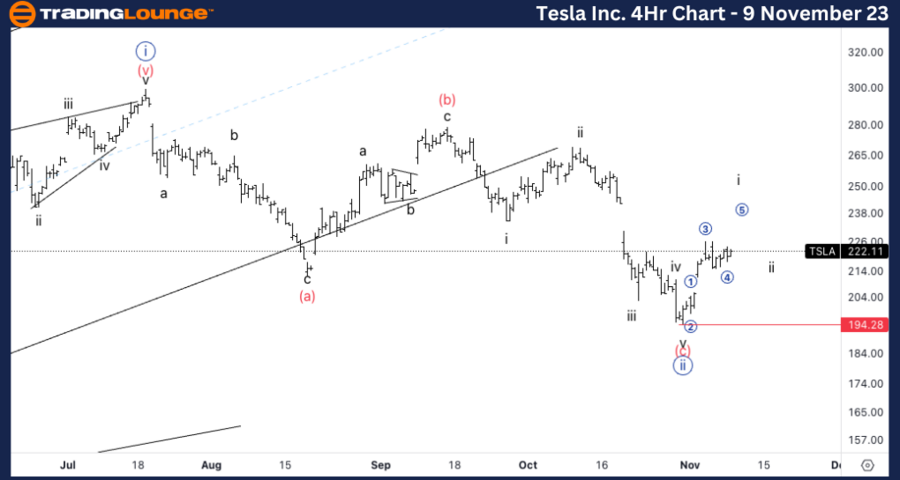
Tesla Inc., Elliott Wave Technical AnalysisTesla Inc., (Nasdaq: TSLA): 4h Chart, 9 November 2023TSLA Stock Market Analysis: Looking for upside into potential wave I as we successfully turned higher after the anticipated bottom in wave (c). Looking for one more leg higher before a potential pullback in wave ii.TSLA Elliott Wave Count: Wave i of (i).TSLA Technical Indicators: Between averages, 20EMA as support.TSLA Trading Strategy: Looking for upside into wave (i). Analyst: Alessio Barretta Tesla Inc., TSLA: 1-hour Chart 9 November 2023Tesla Inc., Elliott Wave Technical Analysis
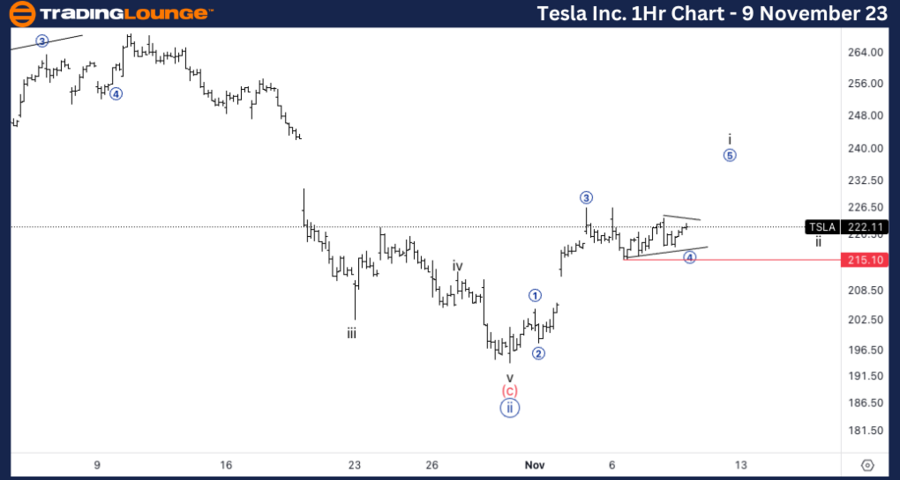
TSLA Stock Market Analysis: Potential triangle into wave 4 of substitute wave i. Looking for the 215$ to hold in order to confirm the triangle. We could expect a sharp move into wave 5 before turning lower for a pullback.TSLA Elliott Wave count: Wave 4 of i.TSLA Technical Indicators: Between averages. TSLA Trading Strategy: Looking for quick longs into wave 5.  More By This Author:Elliott Wave Technical Analysis Day Chart: U.S. Dollar/Japanese Yen – Thursday, Nov. 9
4-Hour Chart Elliott Wave Technical Analysis: USDJPY – Thursday, November 9
Elliott Wave Technical Analysis: ETHUSD – Thursday, November 9


Leave A Comment