Thus far, calendar year 2018 has not been kind to the fixed income arena. Essentially, all of the major asset classes have registered negative returns to some degree, as of this writing. However, there is one exception to the rule: emerging market local debt (EMD).
Needless to say, the general rise in interest rates throughout the developed world has created a rather unfavorable landscape for the fixed income investor. Here in the U.S., the Treasury 10-Year yield has risen, at one point, in excess of 50 basis points (bps) year-to-date, the largest increase in the most closely watched government bond markets. In Europe, U.K. sovereign 10-year yields jumped up 46 bps at their high point, with the like-maturity German bund recording a 34-bps gain at its peak. In Canada, the 10-year government yield was up 33 bps.
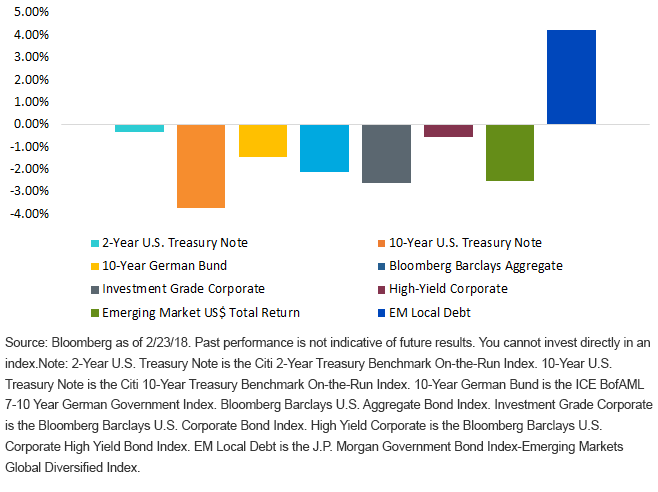
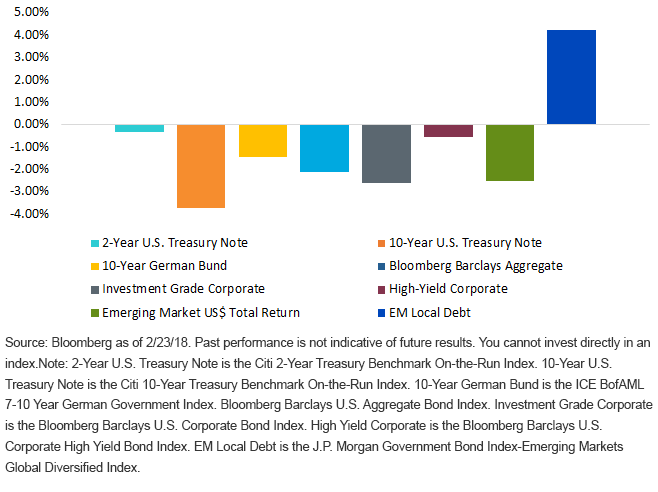
2018 YTD Fixed Income Total Returns

Now, back to the EMD universe. As measured by the J.P. Morgan GBI-EM Global Diversified Composite Yield to Maturity Index, emerging market yields are actually down nearly 10 bps through the latter part of February. This divergence in rate patterns has helped to play an integral role behind the different performance stories. As the reader can clearly see in the accompanying chart, emerging market (EM) local debt is the only asset class that has thus far come in on the plus side of the ledger, year-to-date, posting a return of +4.2% (J.P. Morgan Government Bond Index – Emerging Markets Global Diversified Index). This is in stark contrast to the negative performances seen throughout the developed sovereign debt markets. For the record, the Bloomberg Barclays U.S. Aggregate Bond Index, better known as the Agg, has come in at -2.1%.
For investors looking to diversify their fixed income portfolio by utilizing an EM local debt slice, WisdomTree offers a “structured active” approach. Indeed, building upon our fundamental weighted, otherwise known as smart beta, approach, we have created a strategy that offers the potential for higher income, diversification and total return within the EM local debt universe. Rather than relying on a market cap-based approach, our process leans toward the “balance sheets” of EM countries, an important aspect, especially when one considers the concerns that surrounded EM financial stability a few years back. By focusing on factors such as short-term external debt over international reserves, current account over gross domestic product (GDP) and gross government debt over GDP, we are able to boost allocations to countries that are pursuing monetary and fiscal discipline, while reducing weightings to those that are overextended. The “country” universe is then ranked into three tiers, and then equally weighted. The top tier contains the highest allocations, and of this writing, consists of Brazil, Russia and Indonesia.


Leave A Comment