Video Length: 00:04:01
Friday’s employment report was good news for the stock market bulls.
The economy added 313,000 jobs in February. That’s the biggest one-month gain in almost two years. The closely watched participation rate rose by the most in almost eight years.
The participation rate measures how many working-age individuals are employed or looking for work rather than being discouraged or temporarily out of work.
It’s not a surprise that growth in employment is correlated with growth in the stock market. The relationship between jobs and stocks is simple to understand.
More jobs are bullish for stocks because employees receive wages they can spend. Increased consumer spending boosts the revenue and earnings of publicly traded companies.
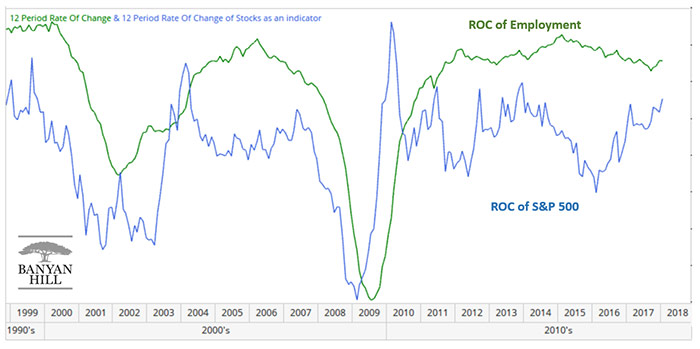
The chart below shows the one-year rate of change (ROC) in employment and the S&P 500.

A few features jump off the chart.
Both employment and stock market prices move in the same direction most of the time. At turning points, the stock market tends to lead.
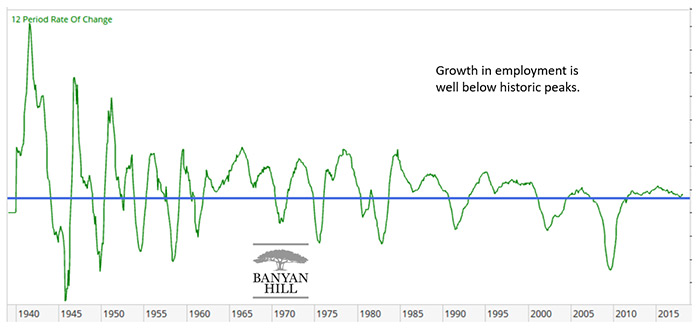
The recent slow and steady growth in employment looks unusual. The next chart shows the long-term historical trend in employment data.

This chart shows the pace of job creation steadied in 1988, after Alan Greenspan took over the Federal Reserve. Prior to that time, the highs and lows were significantly more pronounced.
Greenspan’s goal was to limit downside risks in the economy. His actions also reduced upside volatility.
Employment Report 2018
The current rate of job creation is well below historical standards, in percentage terms. That means there’s ample room for growth.
The rising participation rate confirms growth in employment is possible. Although rising, the participation rate remains well below its historical average.
Millions of potential workers are on the sidelines. Many will join the workforce if wages rise.


Leave A Comment