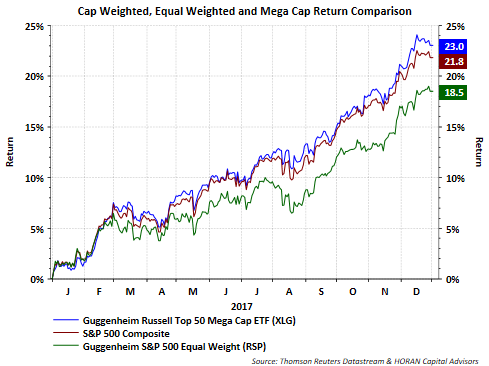
One equity market phenomenon that played out in 2017 was the fact larger capitalization stocks were larger contributors to market returns. One way to evaluate this is to review the return of the cap weighted S&P 500 Index versus the equal weighted Guggenheim S&P 500 Index (RSP). As the below chart shows, the equal weighted index underperformed the cap weighted S&P 500 Index by more than 300 basis points. Additionally, the largest 50 stocks by capitalization (XLG) outperformed both the the S&P 500 Index and the equal weighted S&P 500 Index.

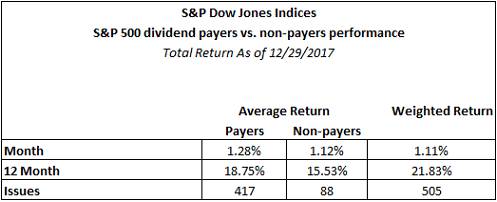
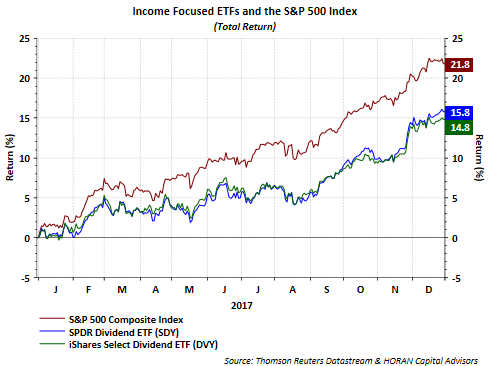
Another area where this capitalization factor played out was looking at the average return of the dividend payers versus non payers in the S&P 500 Index compared to the weighted S&P 500 Index itself. The average return of the payers did outperform the non payers; however, the payers underperformed the weighted S&P 500 Index as seen in the below table. The second chart below compares two of the dividend focused ETFs to the S&P 500 and again, these income ETFs underformed the capitalization weighted ETF. Investors might find investment opportunities in the income oriented equities; however, a rising interest rate environment could be a short term performance headwind for the dividend payers.


Leave A Comment