If there is one factor that perplexes me about the current market environment it is the lack of volatility since the election. The last time the market experienced a greater than 5% correction was in June of 2016 and the last double digit pullback was in February 2016. Going back to 1980 the average intra-year market decline for the S&P 500 Index is 14.1%. I have written a number of recent posts on the positive global economic environment, and at the risk of sounding like a broken record, that may be serving as a tailwind for equity market returns around the world.
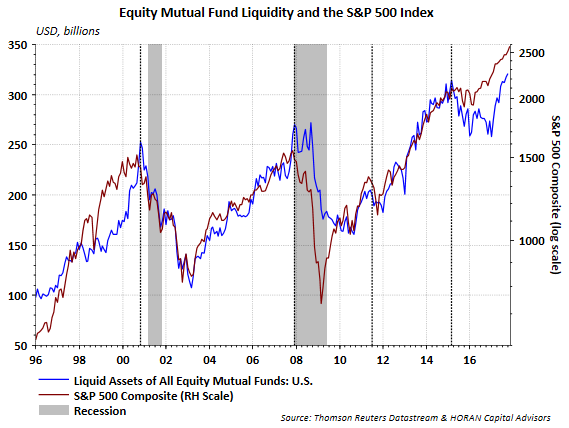
On the surface, if one knew mutual funds were holding elevated cash positions, they might conclude that this is a bullish data point since the cash can be deployed in additional equity investments. On the other hand, elevated liquidity in equity funds may be a sign of investors rapidly allocating more funds to equities and this might actually be a negative sentiment measure. In fact, as the below chart shows, there is a high correlation to elevated liquidity in equity funds and market tops.

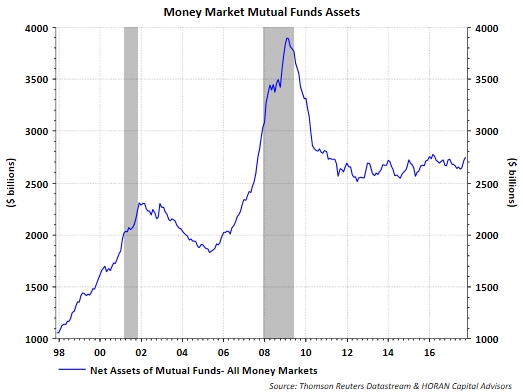
Offsetting the concern the above chart might generate, is that when looking at money market asset levels, they have been fairly stable since 2011, if not rising slightly as seen in the below chart.

Next, one can look at investor sentiment. The weekly American Association of Individual Investors sentiment survey reported bullish sentiment that was essentially unchanged from the prior week at 45.1%. Certainly the AAII bullish sentiment reading is elevated but not at an extreme, and extreme levels are where the sentiment measures are most reliable as contrarian indicators.

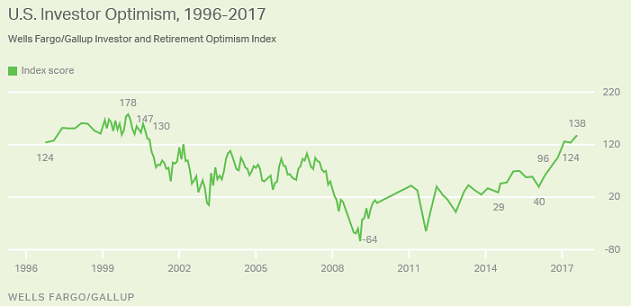
Another sentiment measure was recently reported by the Gallup organization, noting U.S. Investor Optimism rose to a seventeen year high. The reading of 138 was the highest since the index was reported at 147 in September 2000.

So some investor sentiment/optimism indices are near record levels or elevated at a minimum, like the AAII Sentiment Survey measure, yet investors state they are near a low in terms of stock ownership. The Gallup survey reporting equity ownership noted the average percentage of stocks owned by Americans fell in the period 2009 to 2017 versus the 2001 to 2008 time period. The decline occurred in all age groups except for upper income, older Americans. And as the below chart shows, the percentage of adults invested in stocks remains at a near record low.


Leave A Comment