ETH/USD Daily Chart

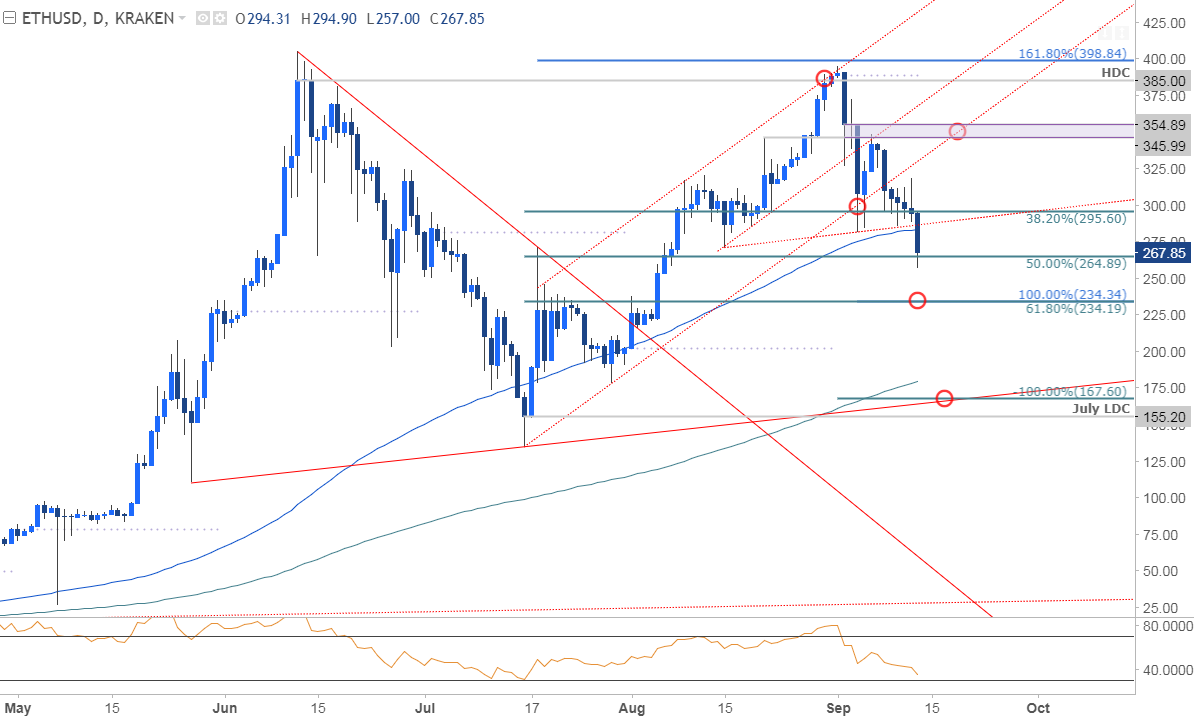
Technical Outlook: Last week we noted that Ethereum prices were approaching key support at the confluence of, “the 100% extension, the 38.2% retracement and the trendline extending off the July lows at 295-303. Heading into the start of the month, the focus will be on this region and price will need to stabilize here if the broader ascending channel structure is to remain viable. . . A break below this region invalidates the broader ascending median-line formation with such a scenario risking a drop into 265/71 and more significant support at 234/37.”
Prices closed below this threshold yesterday with a break of basic trendline support off the mid-August low now risking a larger correction in Ethereum. The decline is now testing the 50% retracement of the July advance at 265 with more significant support seen at the confluence of the 100% ext and 61.8% retracement at 234– a break below that key level, and you’re looking at 167/75.
ETH/USD 240min

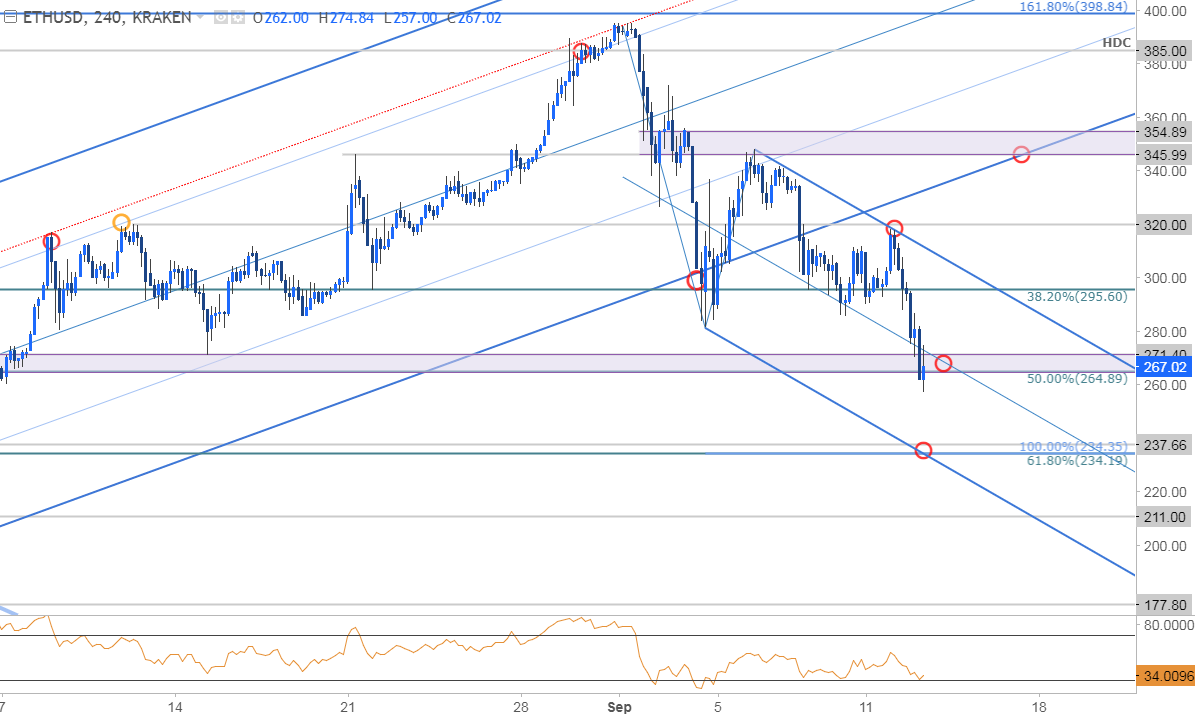
Notes: A closer look at price action highlights Ethereum trading within the confines of a near-term descending median-line formation with prices slipping below support at 264/71 today in early US trade. From a trading standpoint, the focus remains lower while within this formation with a breach above 345/54 now needed to mark resumption of the broader uptrend.
A downside break of this formation would likely fuel accelerated losses for Ethereum with such a scenario eyeing initial targets at 211 & 177. Bottom line: we could see a bit of a recovery here, but the risk remains lower for now with the decline to ultimately offer more favorable long-entries near structural support.


Leave A Comment