EUR/USD
4 hour
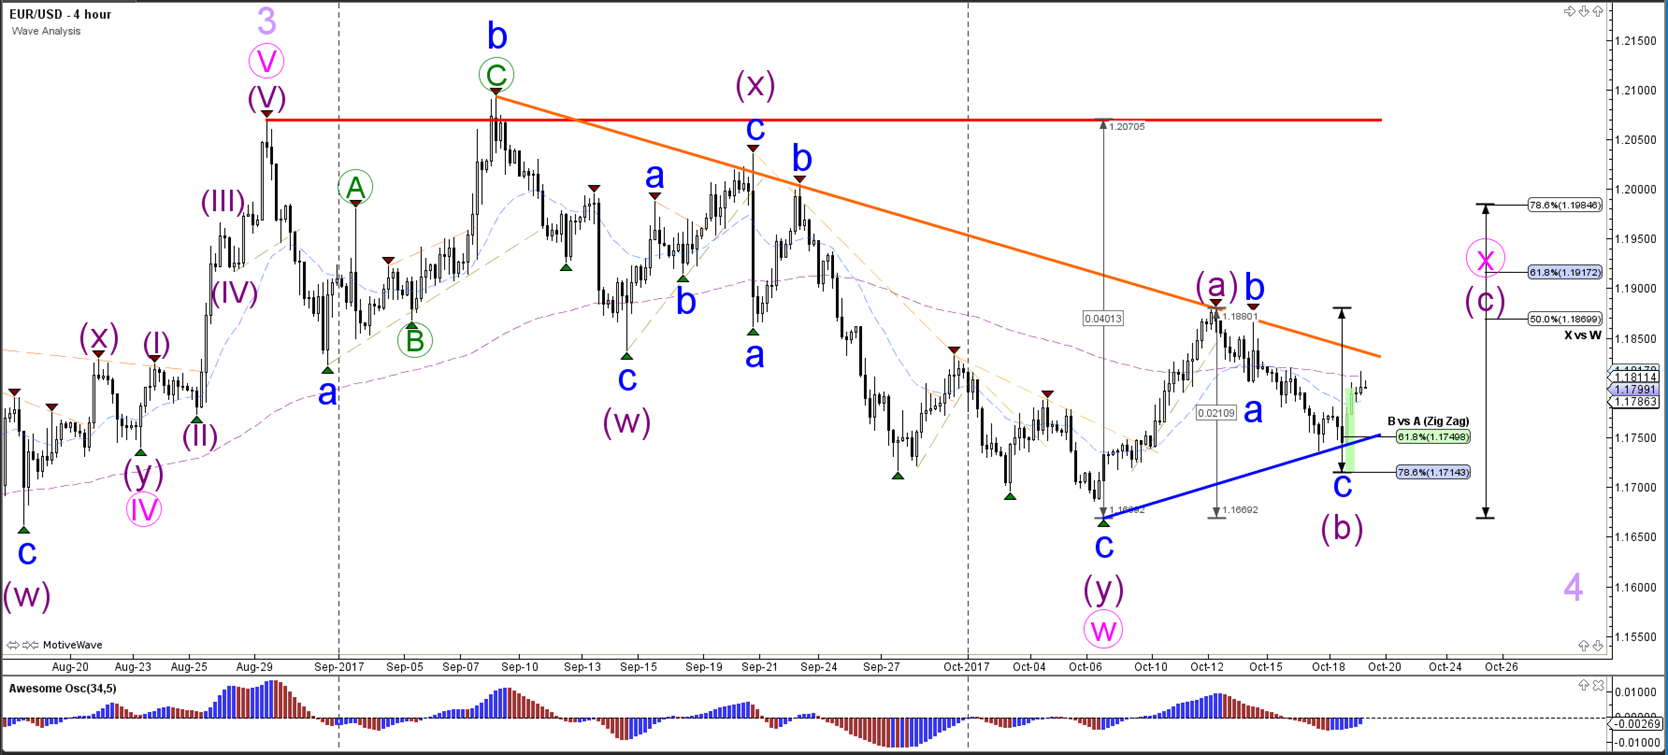
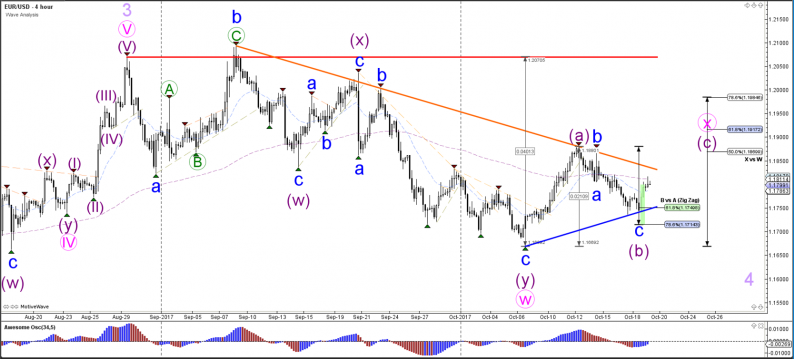
The EUR/USD bounced at the 61.8% Fibonacci level of potential wave B (purple) and support trend line (blue). A break above the resistance trend line (orange) would confirm a bullish breakout within wave C of wave X (pink). A break below the support trend line and 78.6% Fibonacci level makes a bullish ABC less likely and the price will probably continue lower as part of wave 4 (light purple).
1 hour
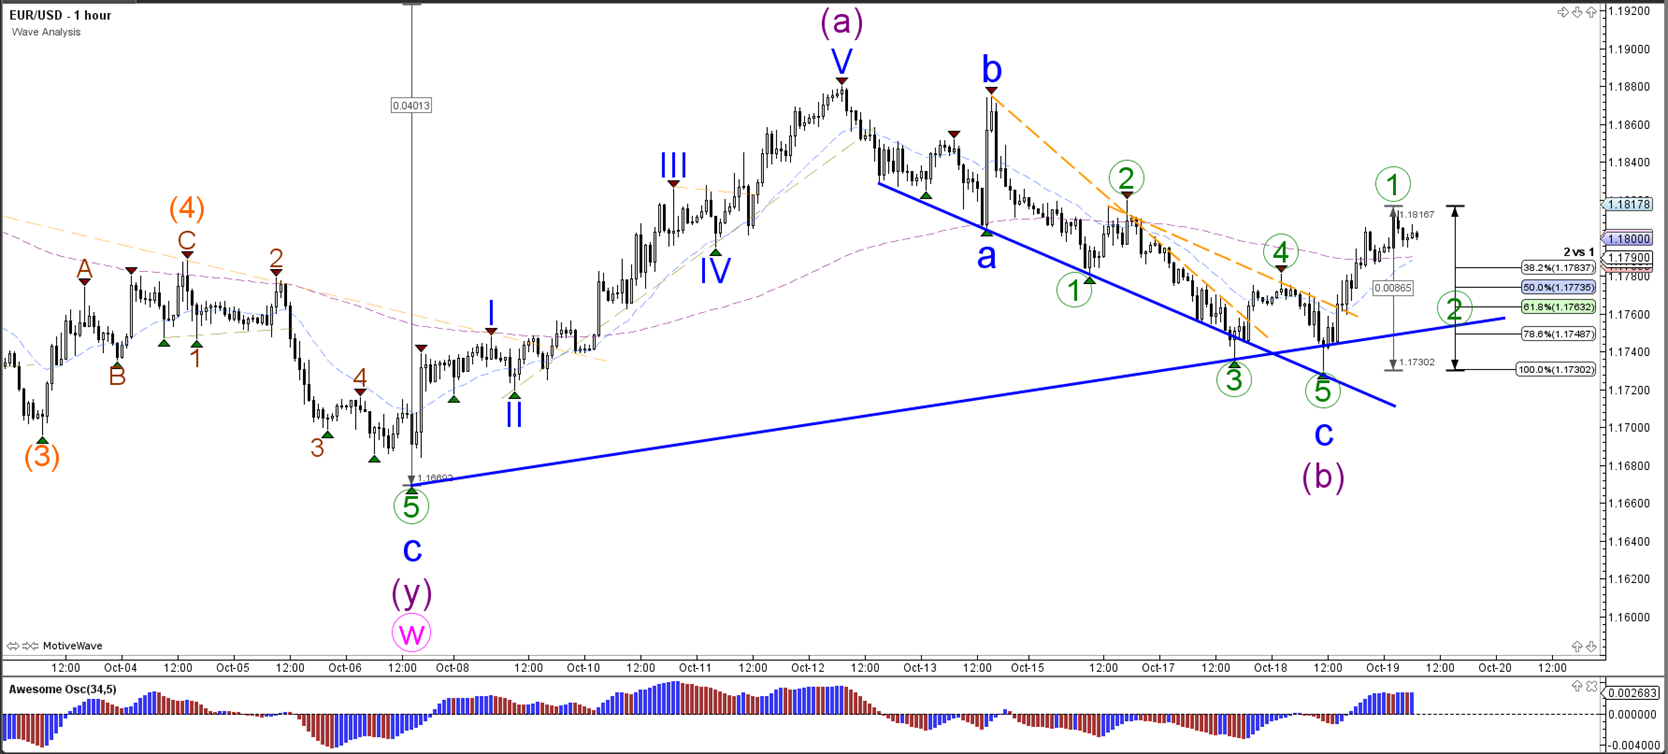
The EUR/USD broke above the resistance trend lines (dotted orange) and could be building a wave 1-2 if the price stays above the 100% Fibonacci level of wave 2 vs 1.
GBP/USD
4 hour
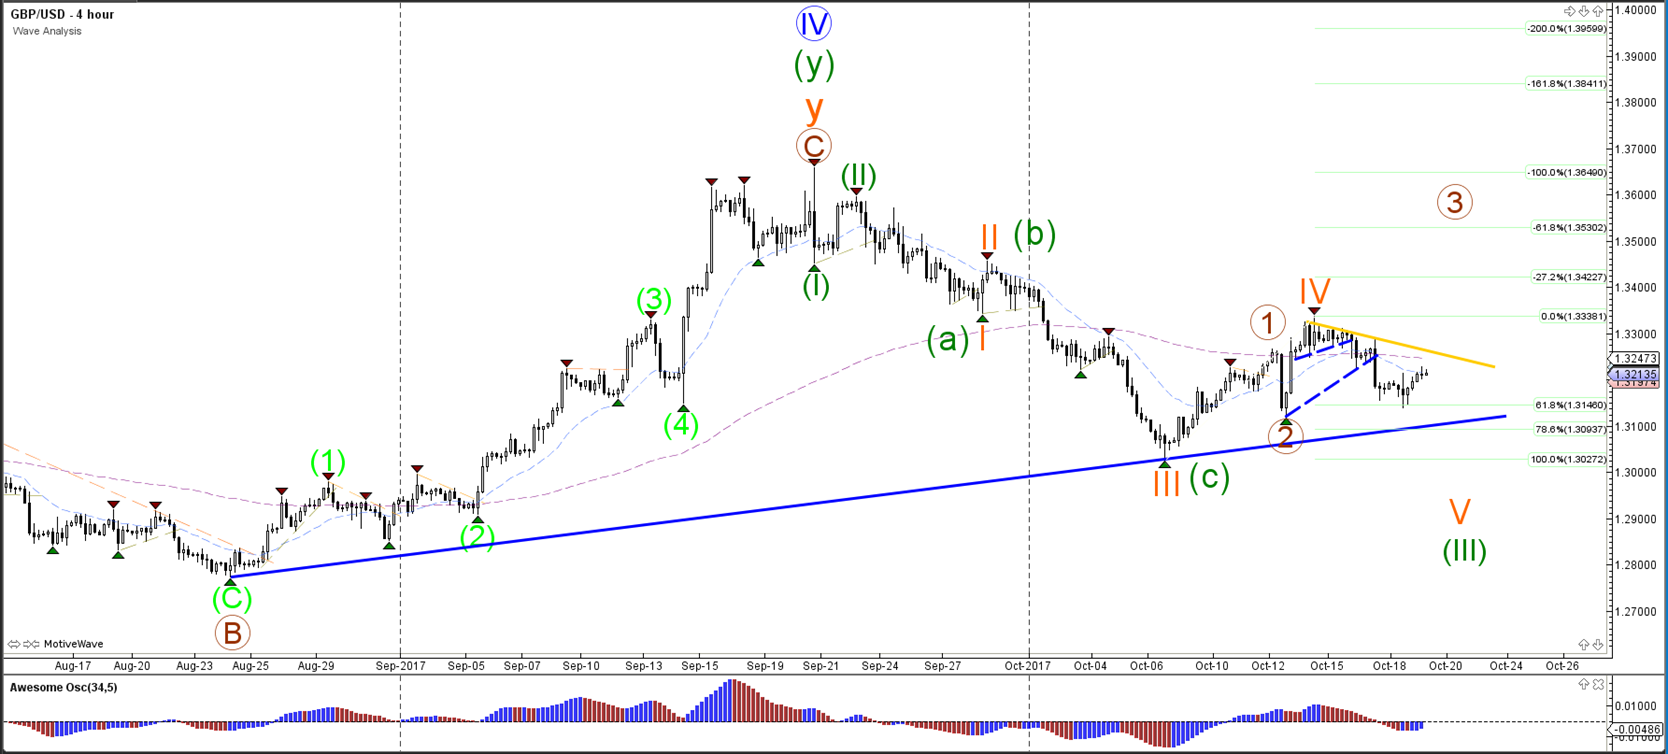
The GBP/USD is still undecided about a bearish or bullish direction and could still go both ways. The two main scenarios are: a bearish ABC (green) or a wave 123 (green) is taking place. Price invalidates that wave 4 (orange) correction if price breaks above the resistance trend line (yellow). A break below the support trend line (blue) increases the chance of a bearish break within wave 5 (orange).
1 hour
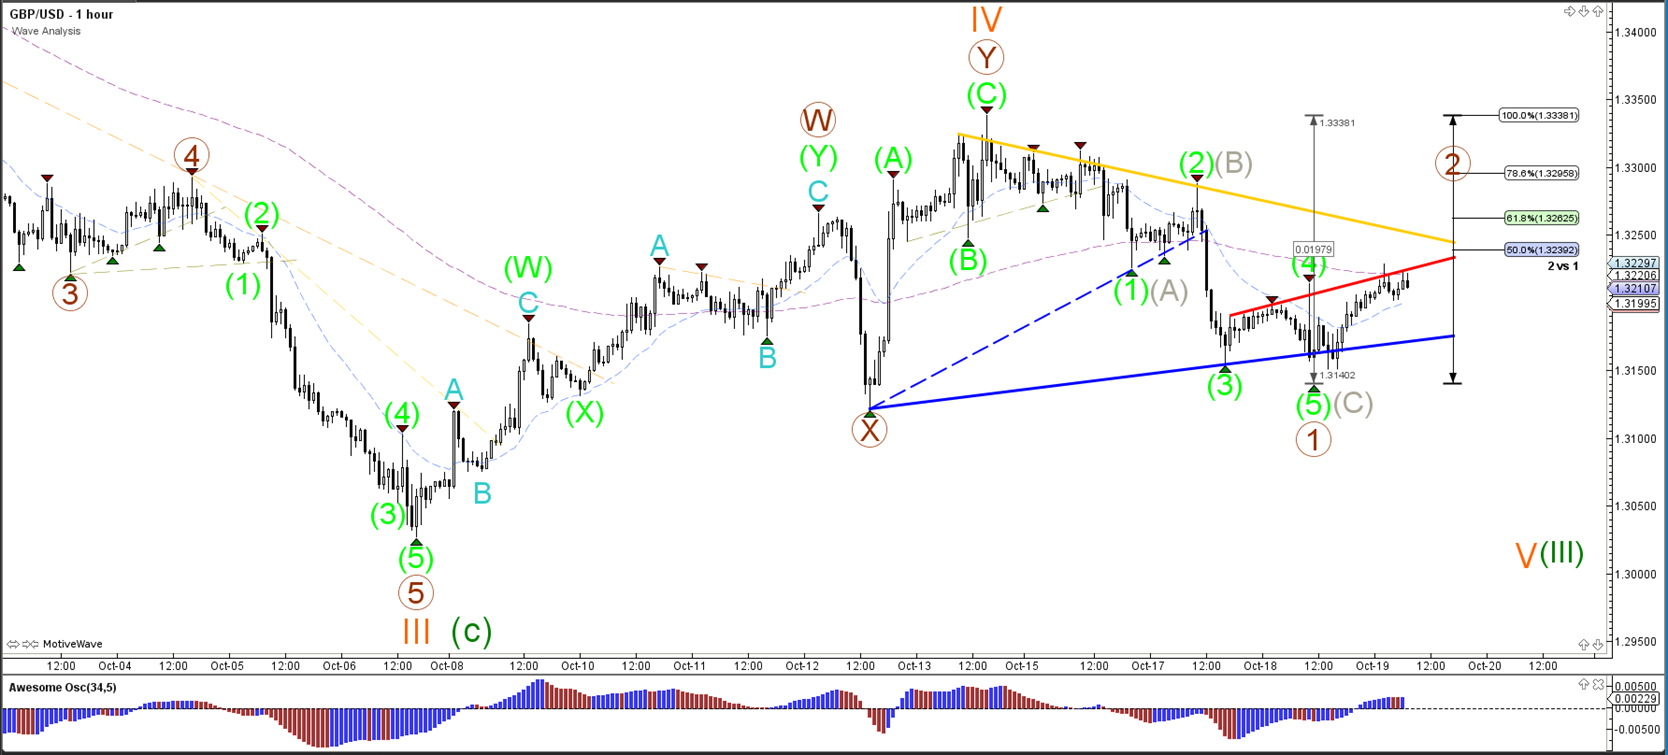
The GBP/USD bounced at the support trend line (blue) and could either be building a wave 1—2 pattern (brown) or an ABC corrective wave (grey). The wave (brown) is invalidated if price breaks above the 100% Fib level.
USD/JPY
4 hour
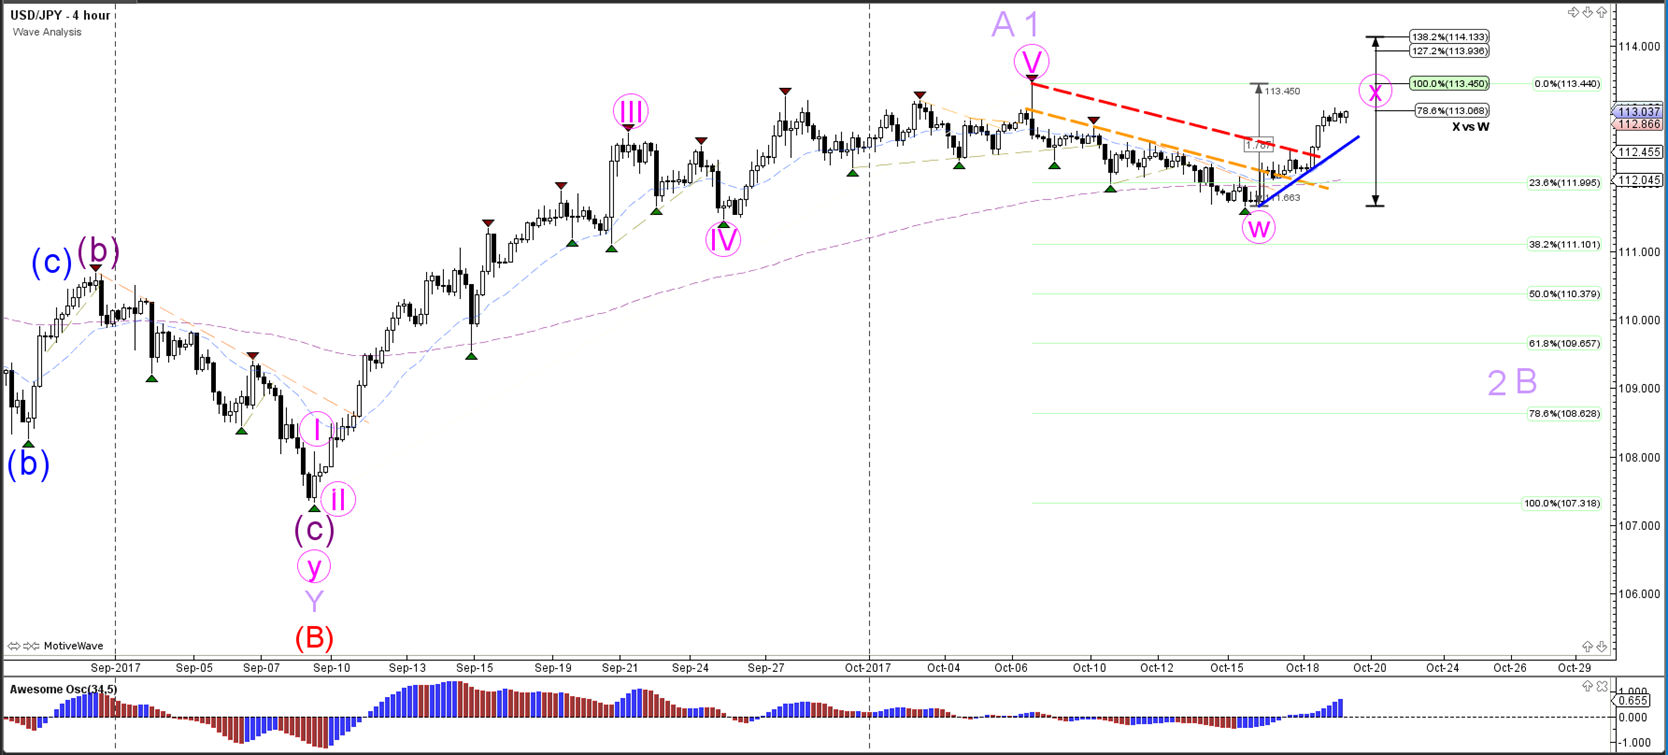
The USD/JPY broke above two resistance trend lines (dotted) but it could be building a larger WXY (pink) correction within wave 2 or B (purple) if the price stays below the 138.2% Fibonacci level of wave X (pink). Strong momentum today, however, could make such a wave 2/B (light purple) correction less likely.
1 hour
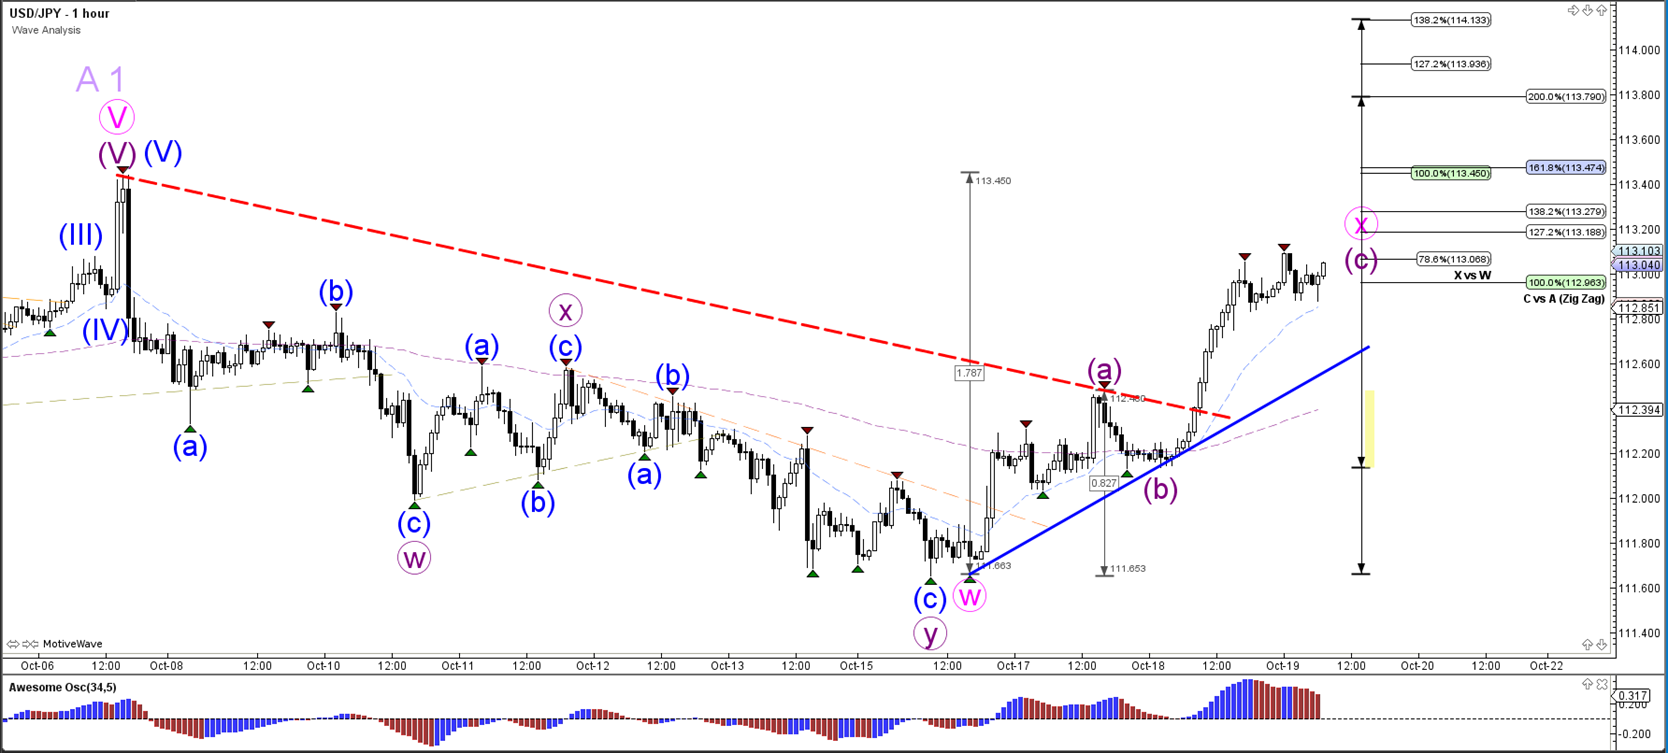
The USD/JPY bullish break above the resistance trend line (dotted red) could be part of a bullish wave C (purple) of wave X (pink) correction. This could be confirmed if price breaks below the support trend line (blue).



Leave A Comment