EUR/USD
4 hour
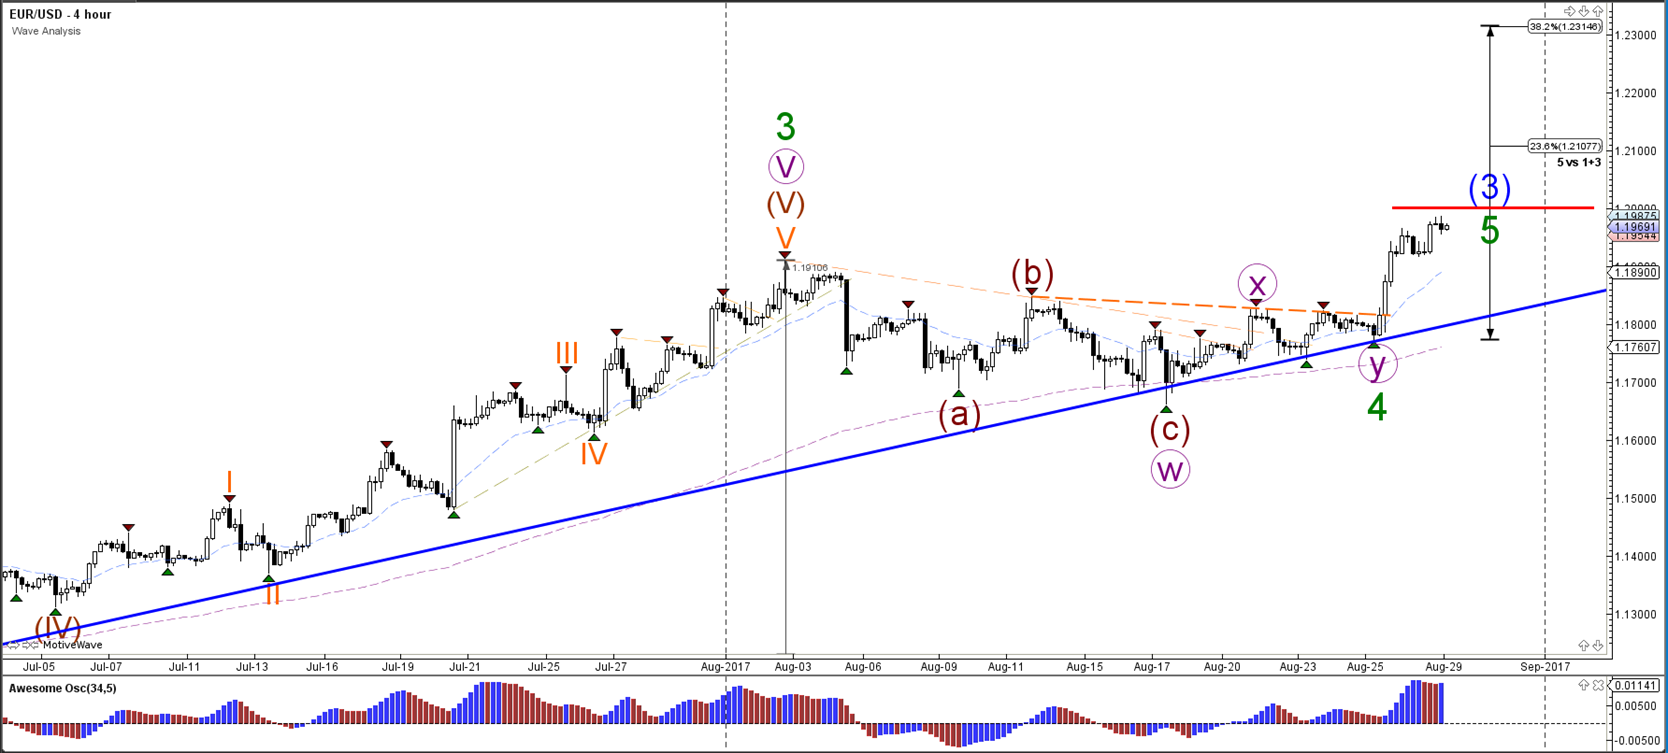
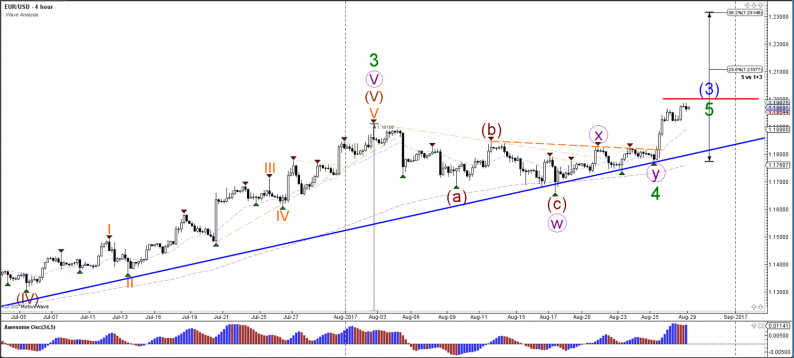
The EUR/USD bullish breakout reached the first target at the round level of 1.20 (red line). Price is at a decision zone now (bounce or break spot) and could make a larger correction at the 1.20 resistance zone such as a wave 4 (blue). A bullish break above 1.20 could signal a potential uptrend continuation.
1 hour
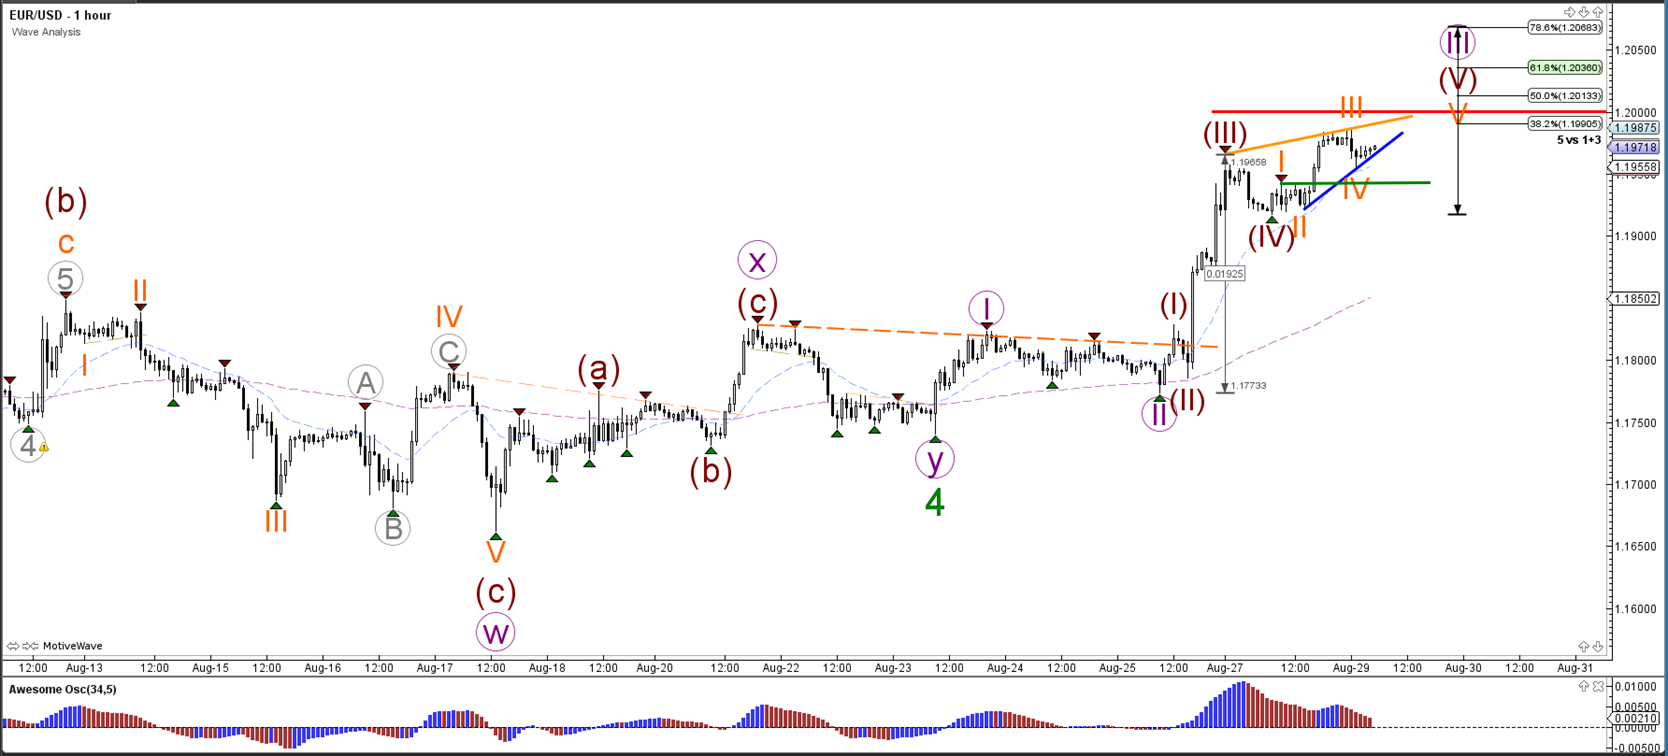
A bearish bounce at 1.20 could create a rising wedge chart pattern (orange/blue) within wave 5 (brown). The EUR/USD does not have to be as large as the wave 4 (blue) on the 4 hour chart because price could also complete a wave 3 of lower degree (purple) at the resistance (red). The size of the expected correction will depend on the chart patterns which unfold at 1.20.
USD/JPY
4 hour
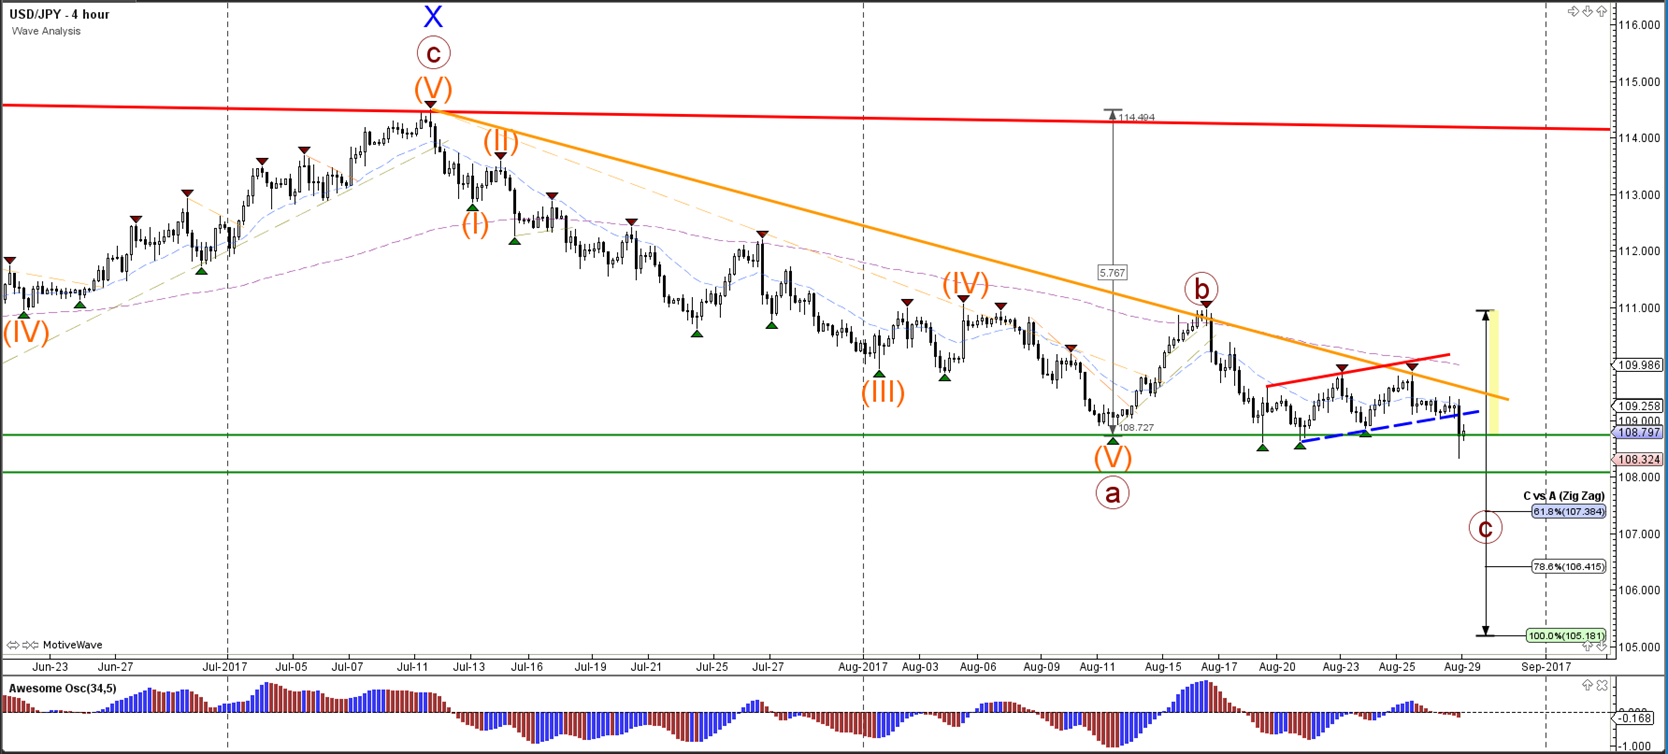
The USD/JPY is trying to break the larger support zone (green lines) and such a bearish break could indicate a downtrend continuation within wave C (brown).
1 hour
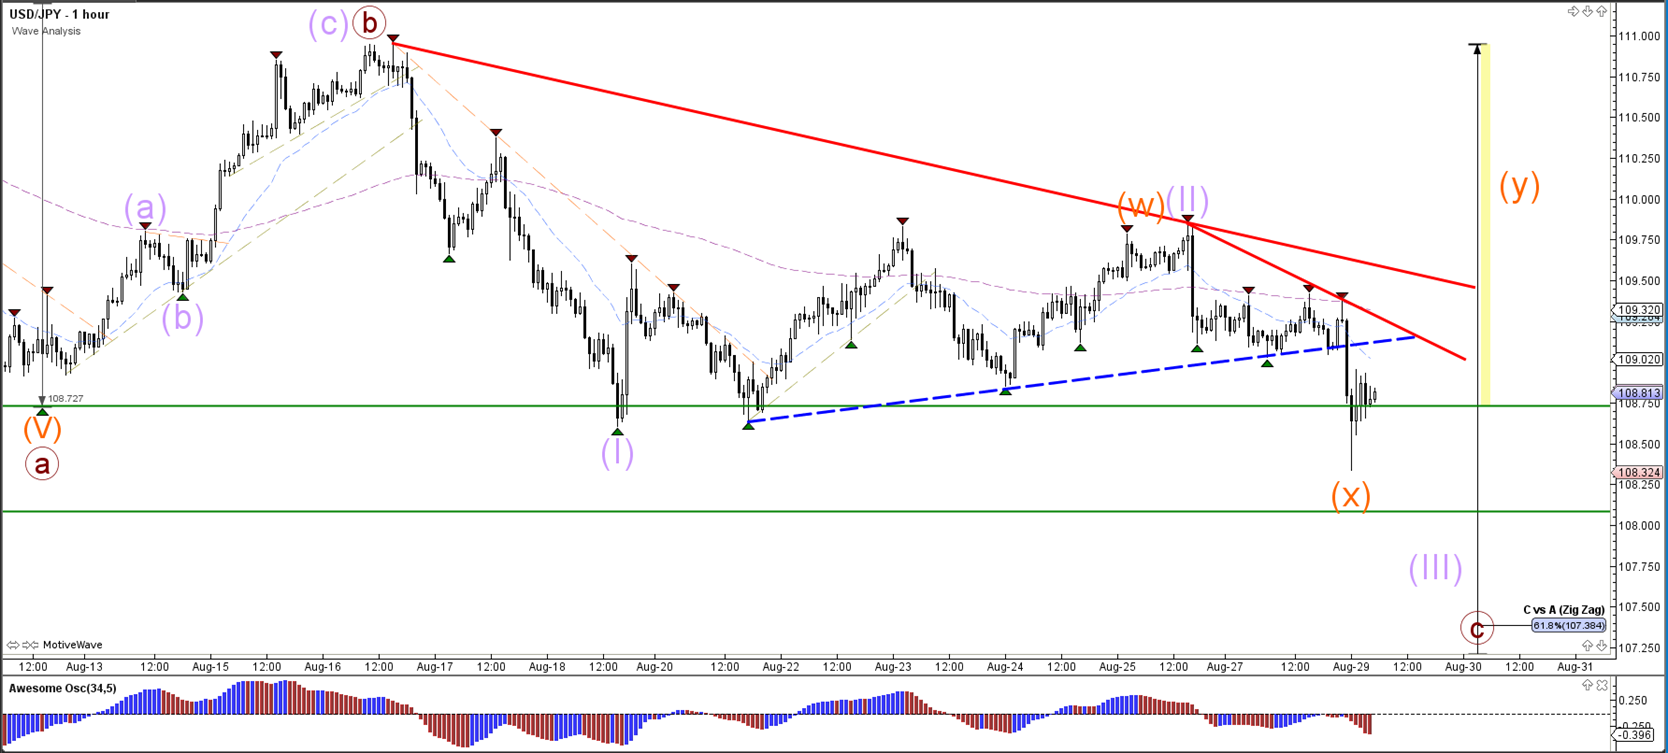
The USD/JPY is either building a bearish wave 3 (purple) or it’s still expanding the correction via a WXY (orange). Price will need to break the support to confirm the bearish direction.
GBP/USD
4 hour
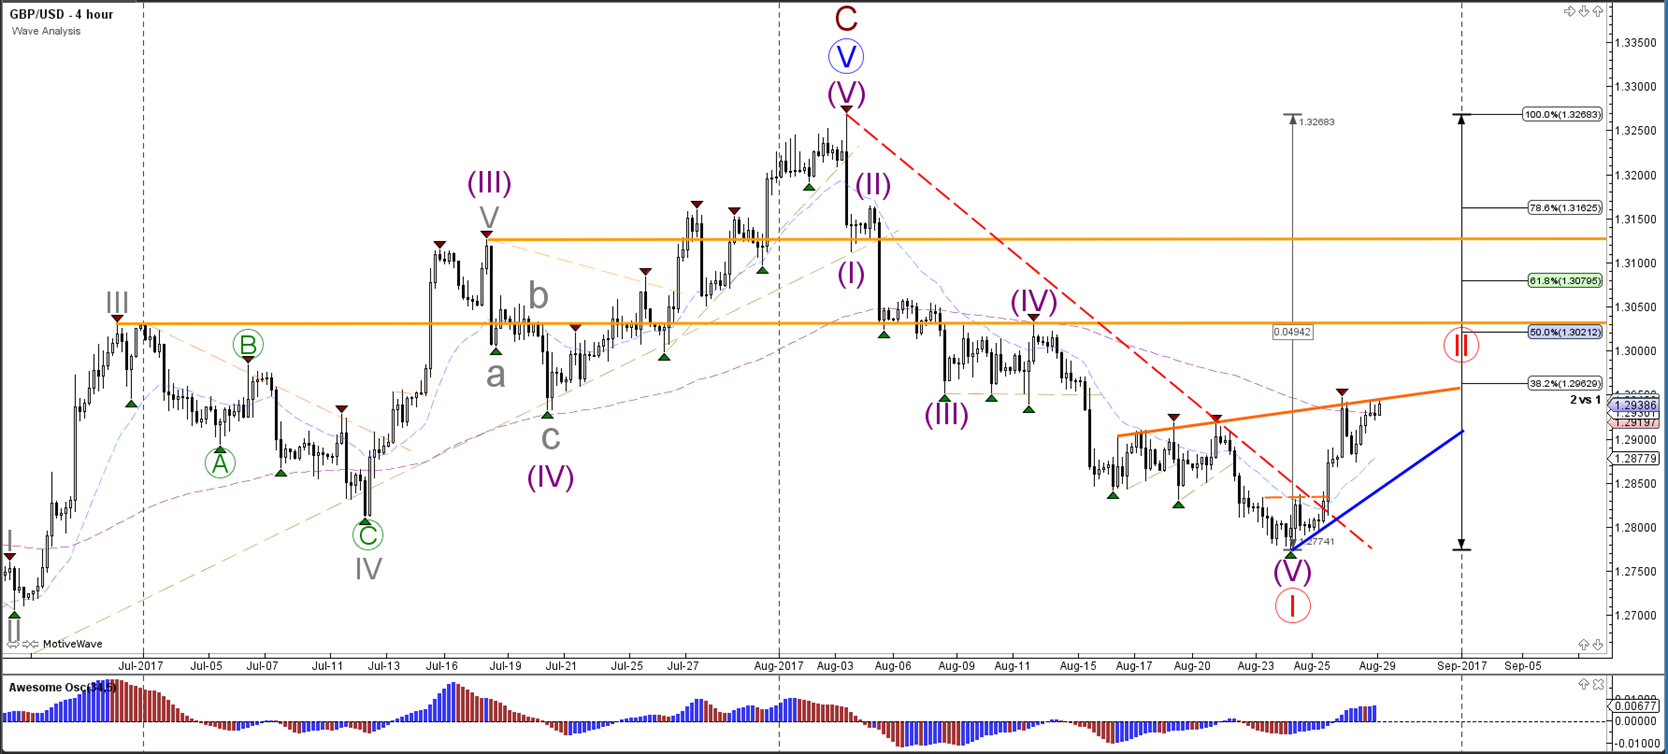
The GBP/USD bullish breakout seems to be part of wave A (purple) of a larger wave 2 (red) correction. The 38.2% Fibonacci retracement level could be a resistance point.
1 hour
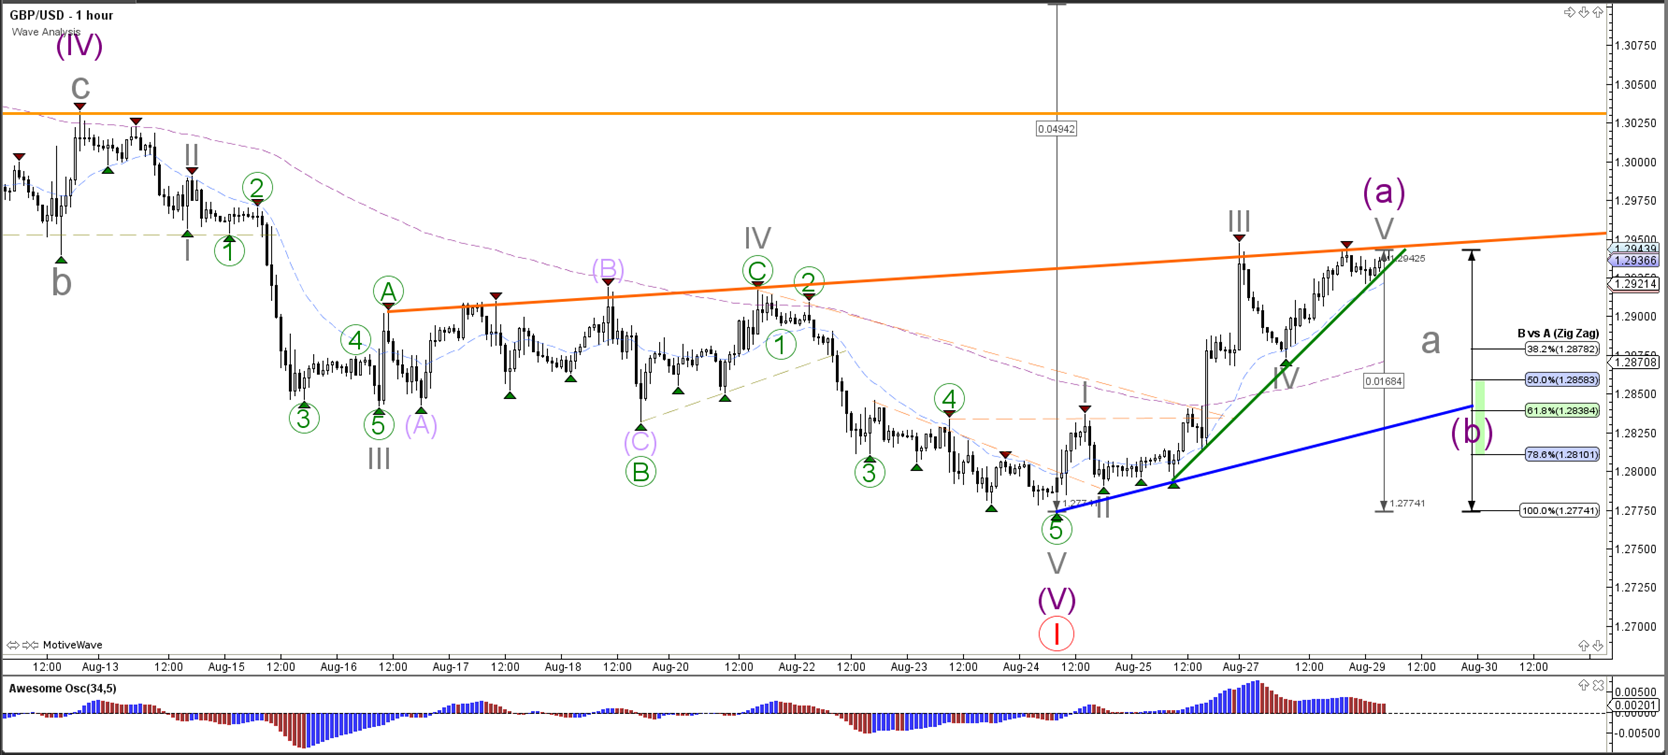
The GBP/USD seems to be building 5 bullish waves (grey) after breaking above multiple resistance trend lines (dotted orange). Price could bounce at the active resistance (orange) trend line and start an ABC (grey) correction within wave B (purple). The Fib levels of wave B vs A could act as support for a bullish bounce to complete wave C.



Leave A Comment