EUR/USD
4 hour
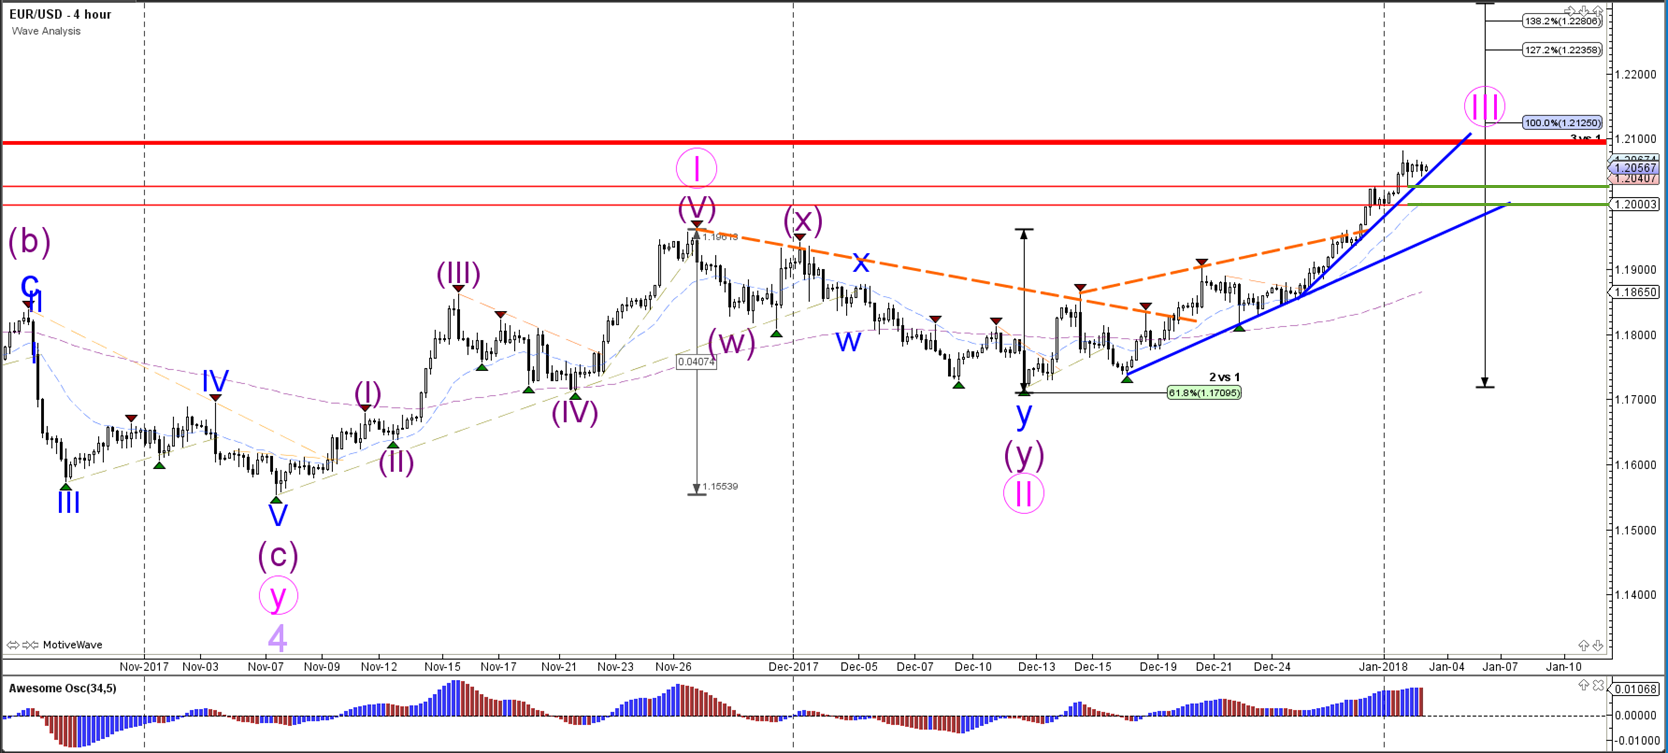
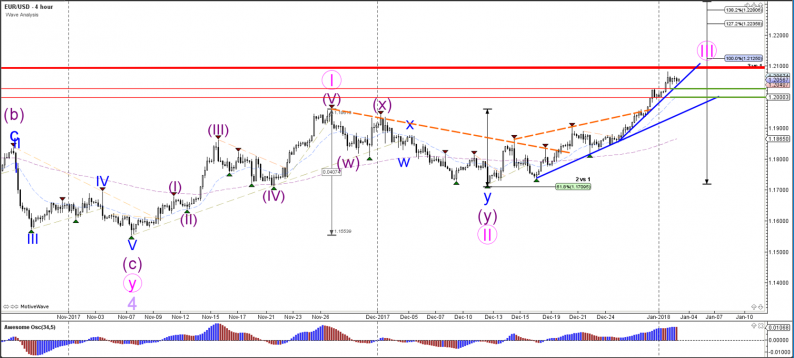
The EUR/USD uptrend broke above the 1.20 round level resistance which now could become used as a potential support zone (green lines). There are also two support trend lines that could keep price from falling. The bearish wave count from yesterday has been invalidated and a bullish wave 3 (pink) is becoming more likely, but a break above the previous top is still needed (red).
1 hour

The EUR/USD stopped at the previous top (red) and is building a correction. The sideways movement could be part of a wave 4 (blue) which typically retraces to a shallower Fibonacci level.
GBP/USD
4 hour
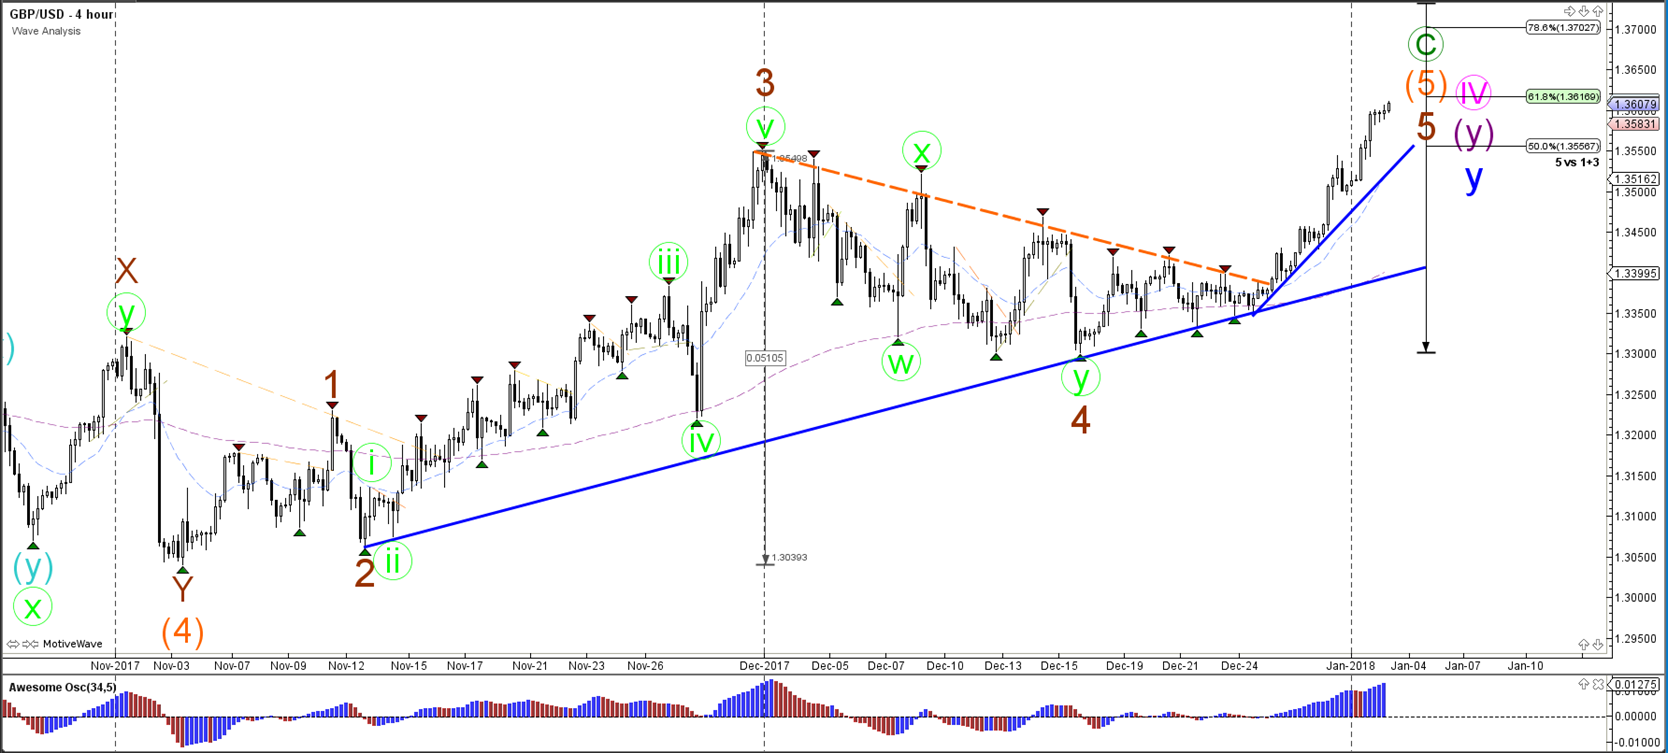
The GBP/USD bullish momentum keeps pushing higher and is moving towards the Fibonacci targets of waves 5, which seems to be part of a wave C (green).
1 hour

The GBP/USD completed a wave 4 (grey) and is now building 5 internal wave (gold) within wave 5 (grey) of wave 3 (blue).
USD/JPY
4 hour
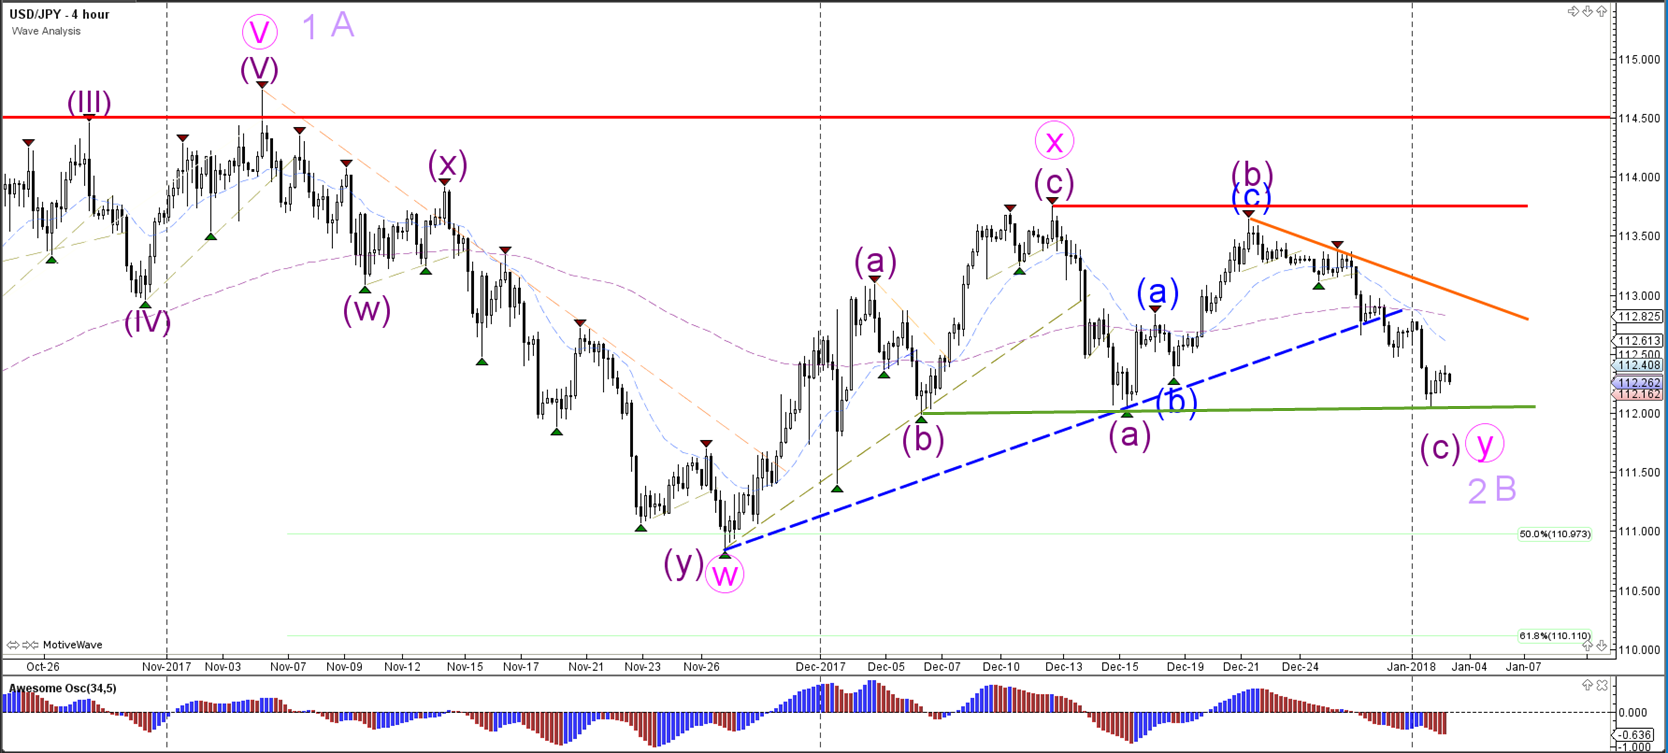
The USD/JPY bearish price action has broken below a larger support trend line (dotted blue), which could be part of a larger bearish wave C (purple) correction within wave 2 or B (light purple).
1 hour
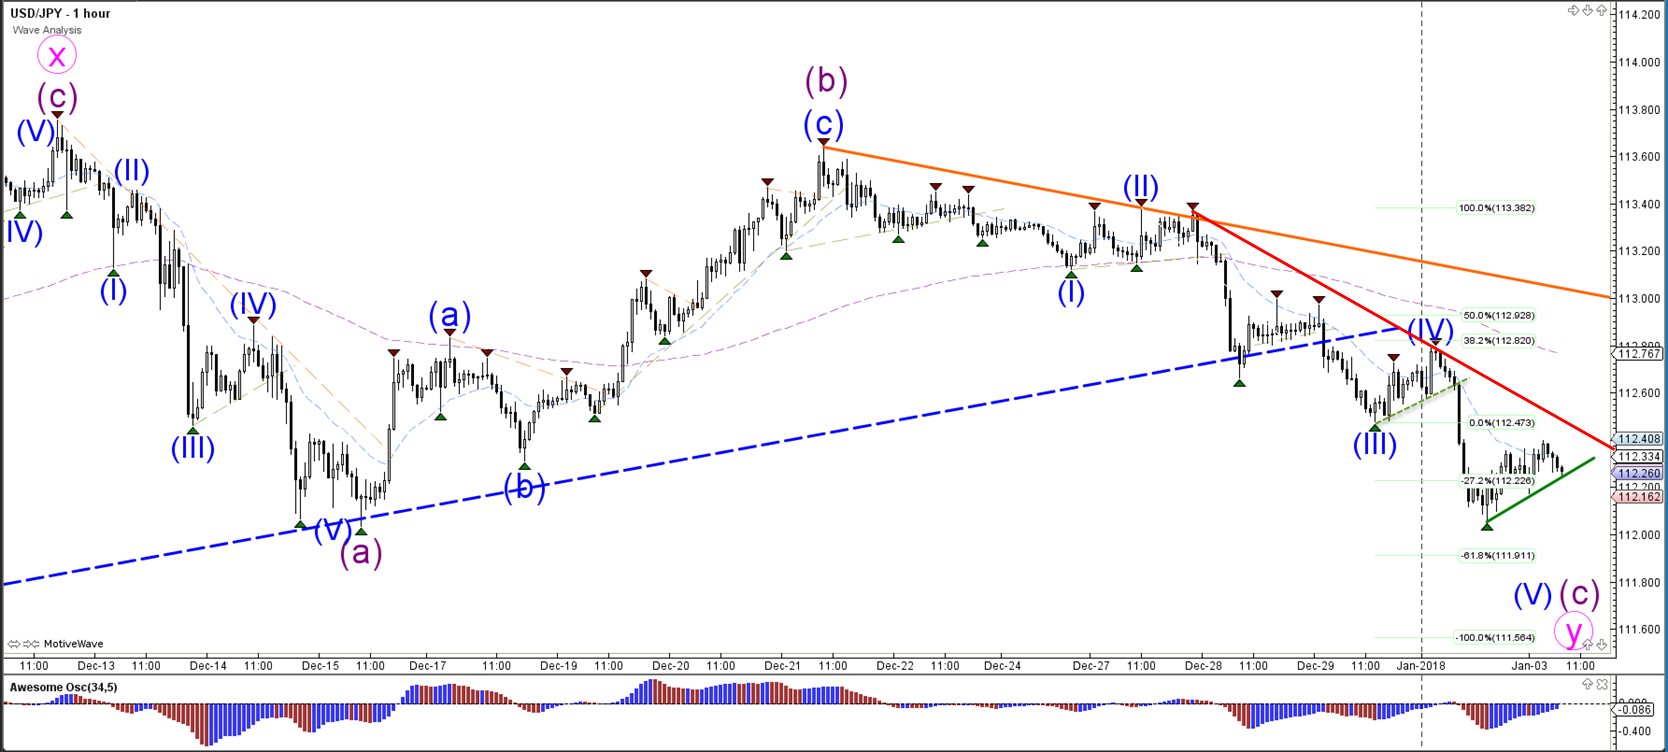
The USD/JPY is building another bear flag chart pattern (blue lines) and a bearish break of the flag could see price continue to fall towards the Fib targets of wave 5.



Leave A Comment