EUR/USD
4 hour

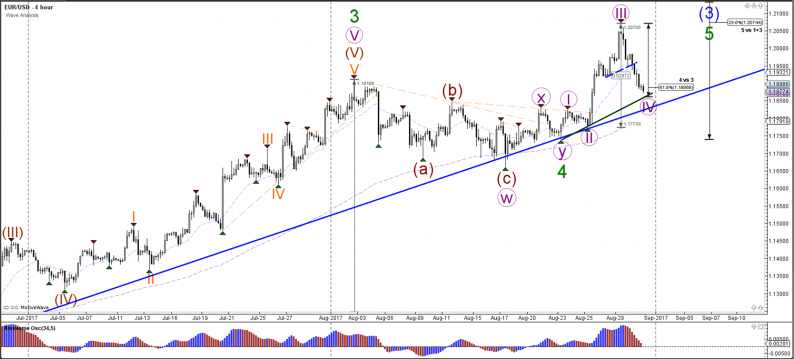
The EUR/USD has made a sharp bearish decline and is now testing the outer limits of a potential wave 4 (purple). A break below the 61.8% makes a wave 4 unlikely and the wave structure would change where wave 5 (purple) of wave 5 (green) of wave 3 (green) would be completed at the most recent high of 1.2070.
1 hour

The EUR/USD is either building an unusually sharp ABC zigzag (brown) within wave 4 (purple) or price is building a bearish 123 wave pattern (red). The wave 3 (red) becomes likely if price manages to break below the support levels (green). A bullish break above resistance (red) could make a wave 4 pattern still possible. In that case, either a wave 5 has started or price could build a triangle for a larger wave 4.
USD/JPY
4 hour

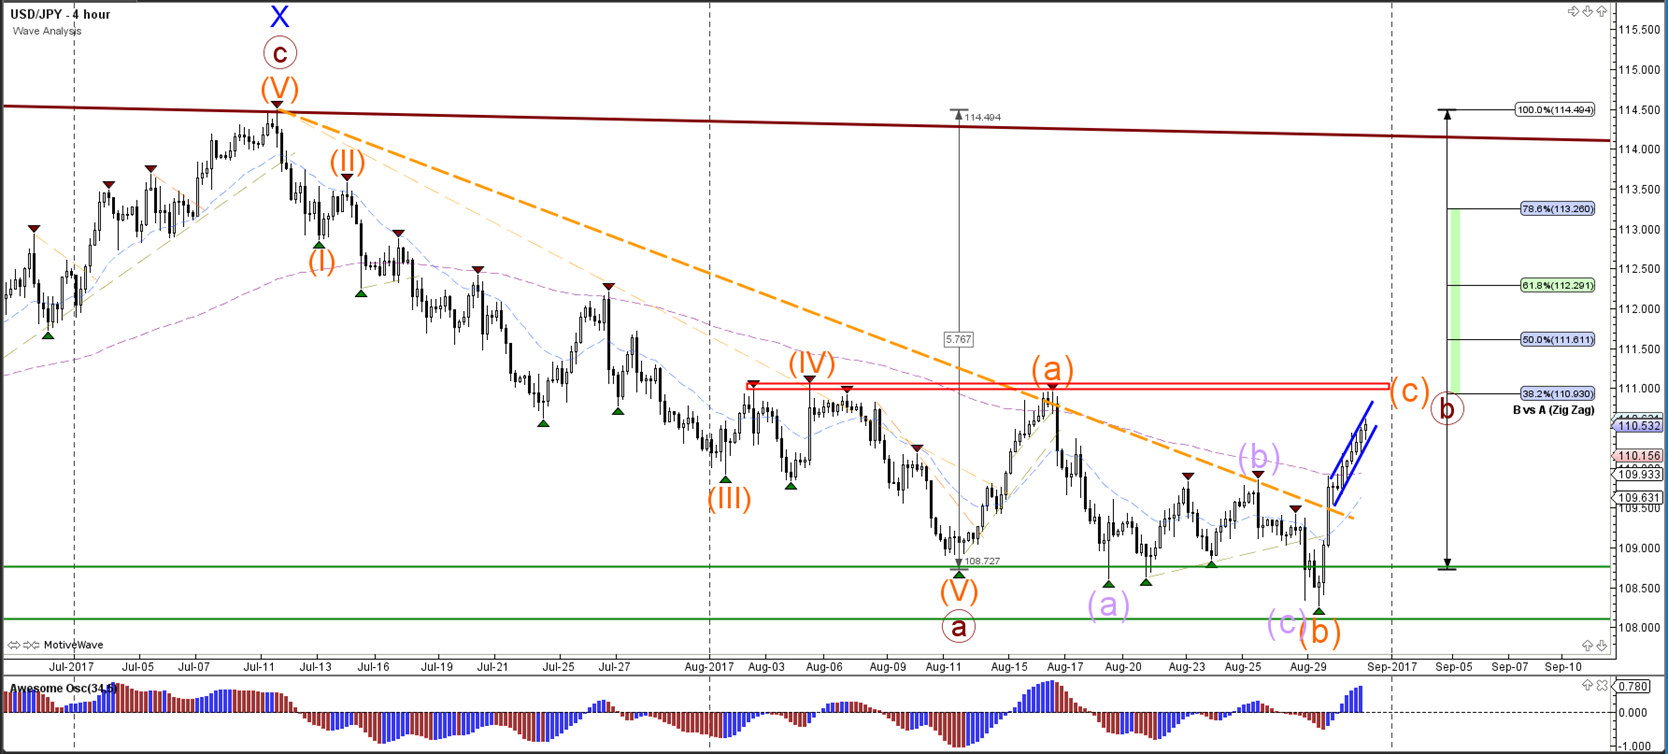
The USD/JPY is building a bullish channel (blue lines) on the lower times. The channel will reach a strong decision spot at 111 because of the strong resistance zone (red box) and 38.2% Fibonacci level.
1 hour

The USD/JPY could potentially extend the bullish momentum in wave 5 (purple) to the resistance at 111.
GBP/USD
4 hour

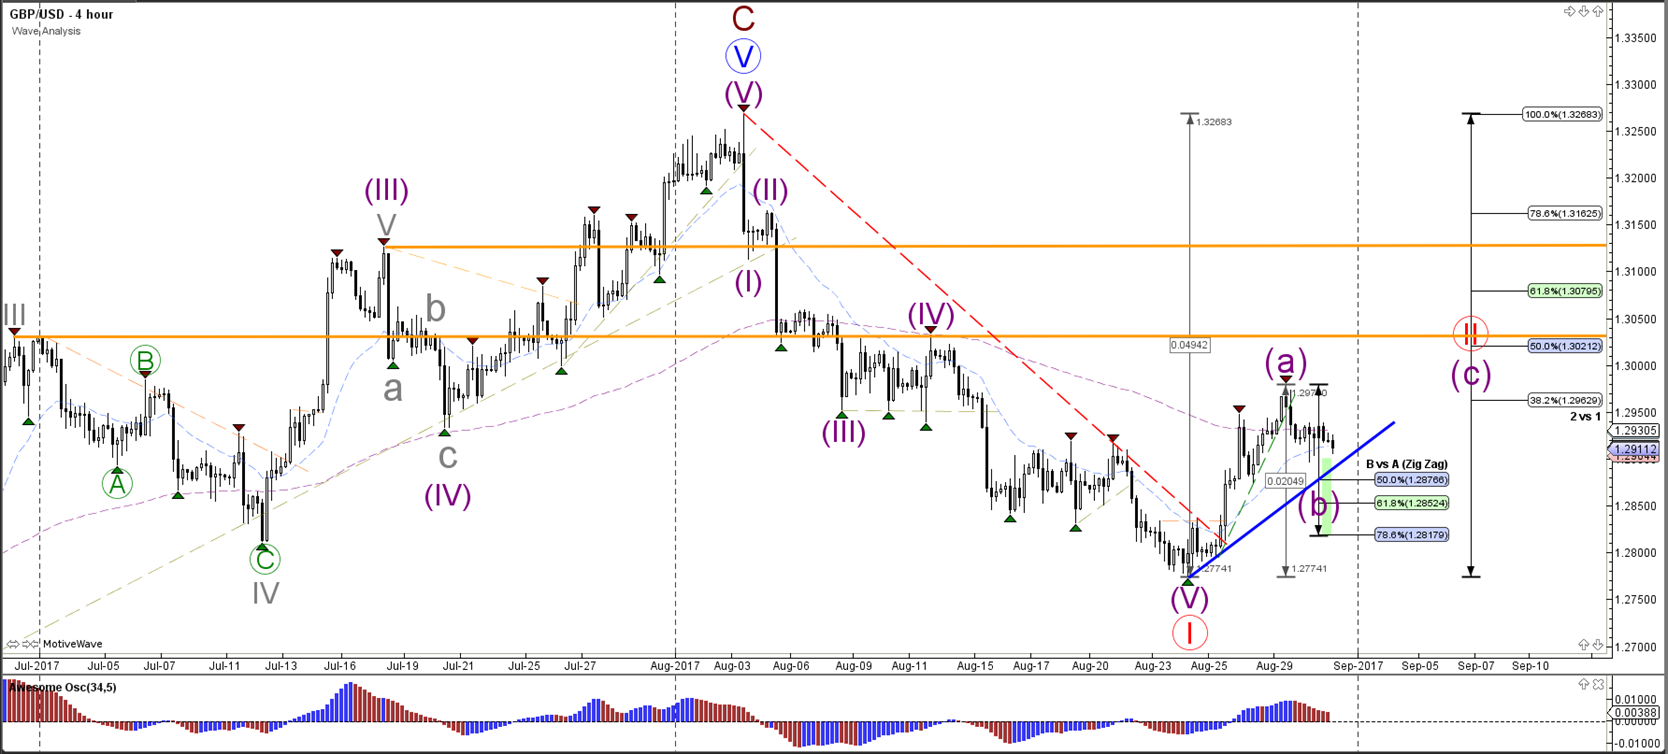
The GBP/USD bullish momentum has completed a wave A (purple) at the 38.2% Fibonacci resistance level and perhaps a wave B (purple) at the 50% Fib.
1 hour

The GBP/USD tried to break above resistance (dotted orange) yesterday but did not manage to continue. This could be a pullback but price will need to break above resistance (red) again to confirm a potential bullish break for wave C (purple).


Leave A Comment