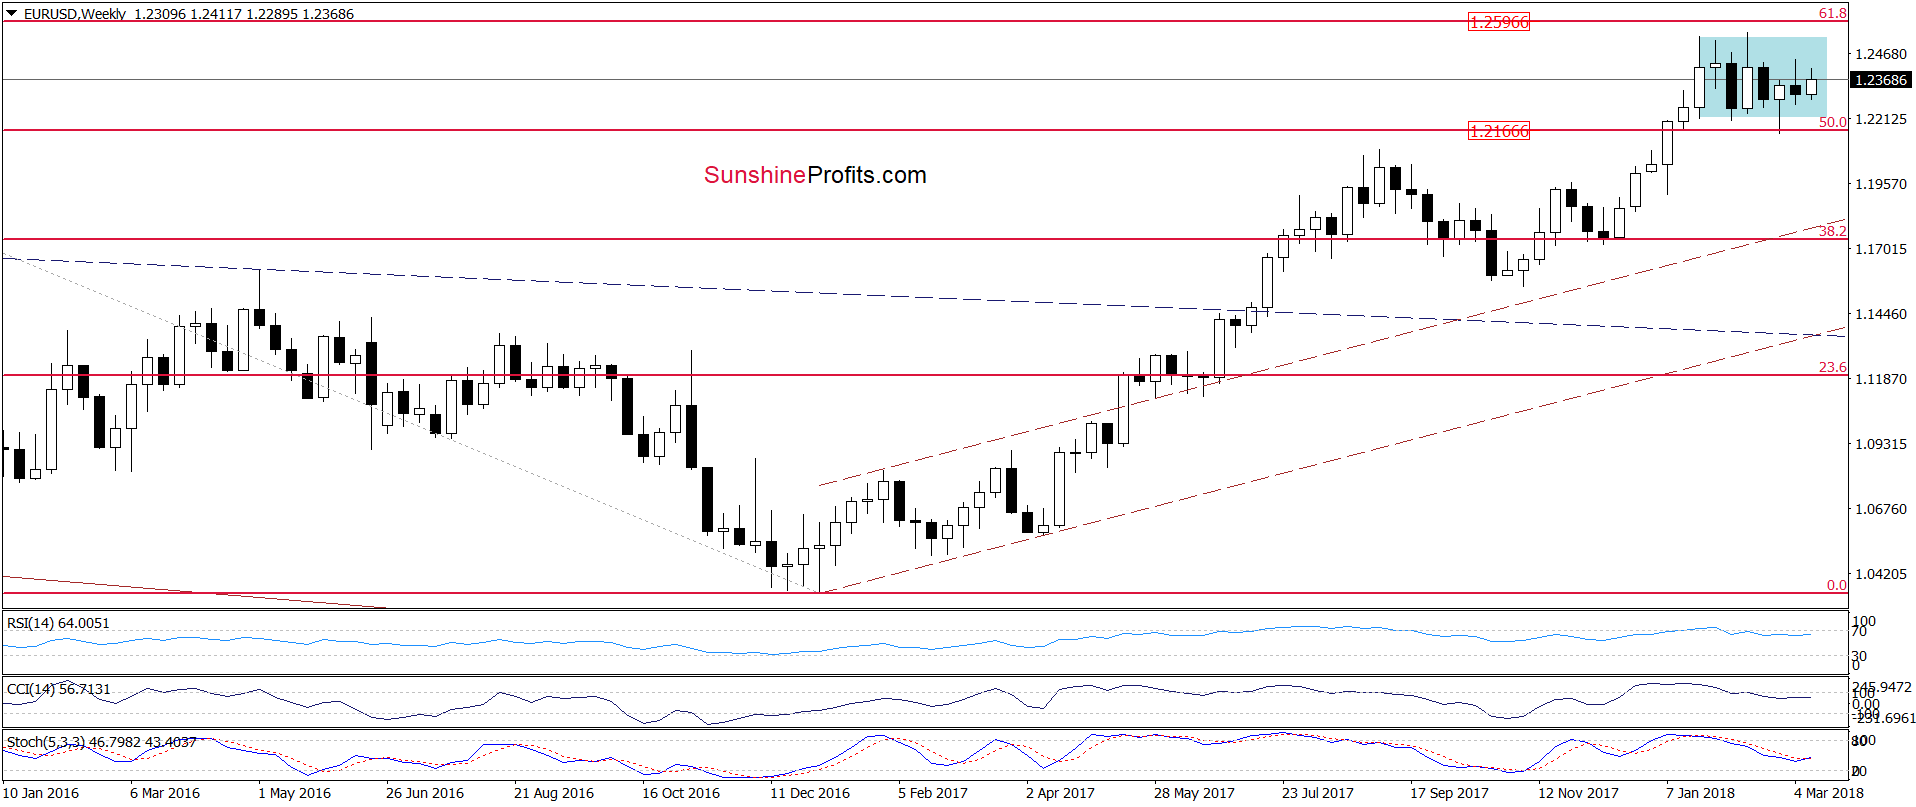
Since the beginning of the month all battles between bulls and bears run in a fairly narrow area, which unfortunately doesn’t create good investment opportunities. In today’s alert, we looked at the broader perspective of EUR/USD and the USD Index itself, and we already have our own types where we will likely open next positions. If you do not want to miss the levels that we think about, take a look at our today’s analysis.
EUR/USD

From today’s point of view, we see that the situation in the very short term hasn’t changed much as EUR/USD is currently trading inside yesterday’s black candle under the black declining resistance line.
This means that our last commentary on this currency pair remains up-to-date:
(…) On one hand, the buy signal generated by the Stochastic Oscillator is still active, supporting currency bulls and higher values of the exchange rate.
On the other hand, the probability of the head and shoulders formation remains in the cards – especially when we factor in the fact that EUR/USD reversed and decline after a climb to the black declining resistance line based on the previous highs.
Such price action suggests that despite the support from the site of the Stochastic, the pair could move lower and test the blue support line (the neck line of the above-mentioned pattern) in the coming day(s).
If we see a breakdown under this line, we’ll consider opening short positions.
Nevertheless, when we zoom out our picture, we’ll find the answer to the major question: why the hell the euro is not falling yet?

As you see on the weekly chart, the exchange rate is still trading inside the blue consolidation, which suggests that as long as there is no confirmed breakout above the upper border of the formation (or a breakdown under the lower line) another significant move is not likely to be seen.


Leave A Comment