Next week brings a pivotal ECB rate decision on Thursday. This is the last rate decision before the bank’s December meeting in which the current stimulus program is set to expire, and the large expectation for next Thursday is that we’ll see the European Central Bank ‘recalibrate’ their stimulus program. In latter September, the ECB’s Chief Economist said that the bank would not look at a full-scale stimulus exit, instead electing to recalibrate current measures. The expectation around that is that we’ll see a smaller monthly amount of purchases beyond the current expiration of December 2017. The big question there is by how much and for how long?
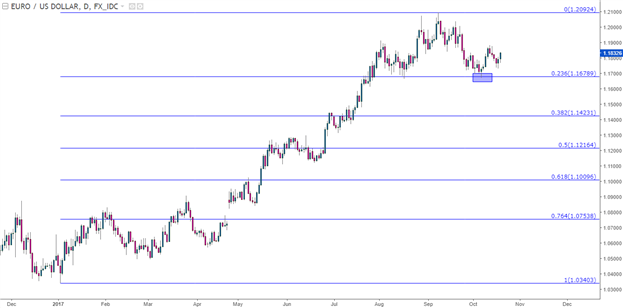
For its part, EUR/USD has remained relatively bullish on longer-term charts, continuing to find support around a key zone. Near-term price action put in a bearish move in latter-September as we opened into Q4, and for much of October the pair has seen some type of sideways price action. But the longer-term zone of support that runs from 1.1685-1.1736 remains after multiple tests over the past three months. To put into scope how relatively minor this retracement has been, we’re looking at the 2017 bullish trend on the below chart, and notice how we had only retraced a mere 23.6% of this year’s bullish move.
EUR/USD Daily: 23.6% Retracement of the 2017 Bullish Trend

Chart prepared by James Stanley
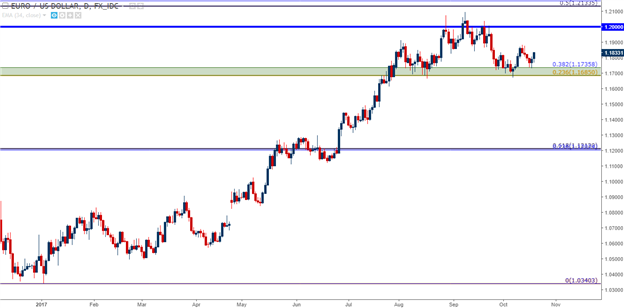
It’s the longer-term connotations around that area of support that are perhaps more interesting. At 1.1685 we have the 23.6% retracement of the 2008-2017 major move; and at 1.1736 we have the 38.2% retracement of the ECB QE move, taking the 2014 high down to the 2017 low. Collectively these prices produce a zone of support that’s helped to elicit buyers into the pair since mid-August.
EUR/USD Daily: 2017 Bullish Trend Remains Supported at Longer-Term Zone

Chart prepared by James Stanley
On shorter-term charts, we have the prospect of a recent higher-low indicating the potential return of the longer-term bullish trend. Earlier in October, we saw a test of the bottom side of the zone; but as NFP came in at -33k, another round of USD weakness developed and buyers pushed the pair higher. On a subsequent re-approach towards support earlier this week – buyers stepped in at the top-side of the zone, offering a higher-low on the hourly chart. If this can be accompanied by a near-term higher-high, as denoted by a topside break of the prior swing at 1.1880, the door is opened for bullish continuation as we move towards ECB. Targets can be investigated at prior levels of resistance; around 1.2000, and then around 1.2050. If we do get a topside break of the 2017 high, additional targets can look towards 1.2134 (Fibonacci level) and then 1.2250 (psychological level).


Leave A Comment