Initial Claims made a new low for this economic expansion in April 2018. This is a medium-long term bullish sign for the stock market. Initial Claims leads the economy, which leads the stock market.

Historically, economic recessions either led to bear markets in equities or “significant corrections”. The following chart shows how Initial Claims is a leading indicator for the stock market.

*Initial Claims always trended upwards before a recession began. But as stock market investors, we are more interested in how this data series leads the stock market.
Bear markets
The S&P 500 made 4 bear markets since 1950. These bear markets began on:
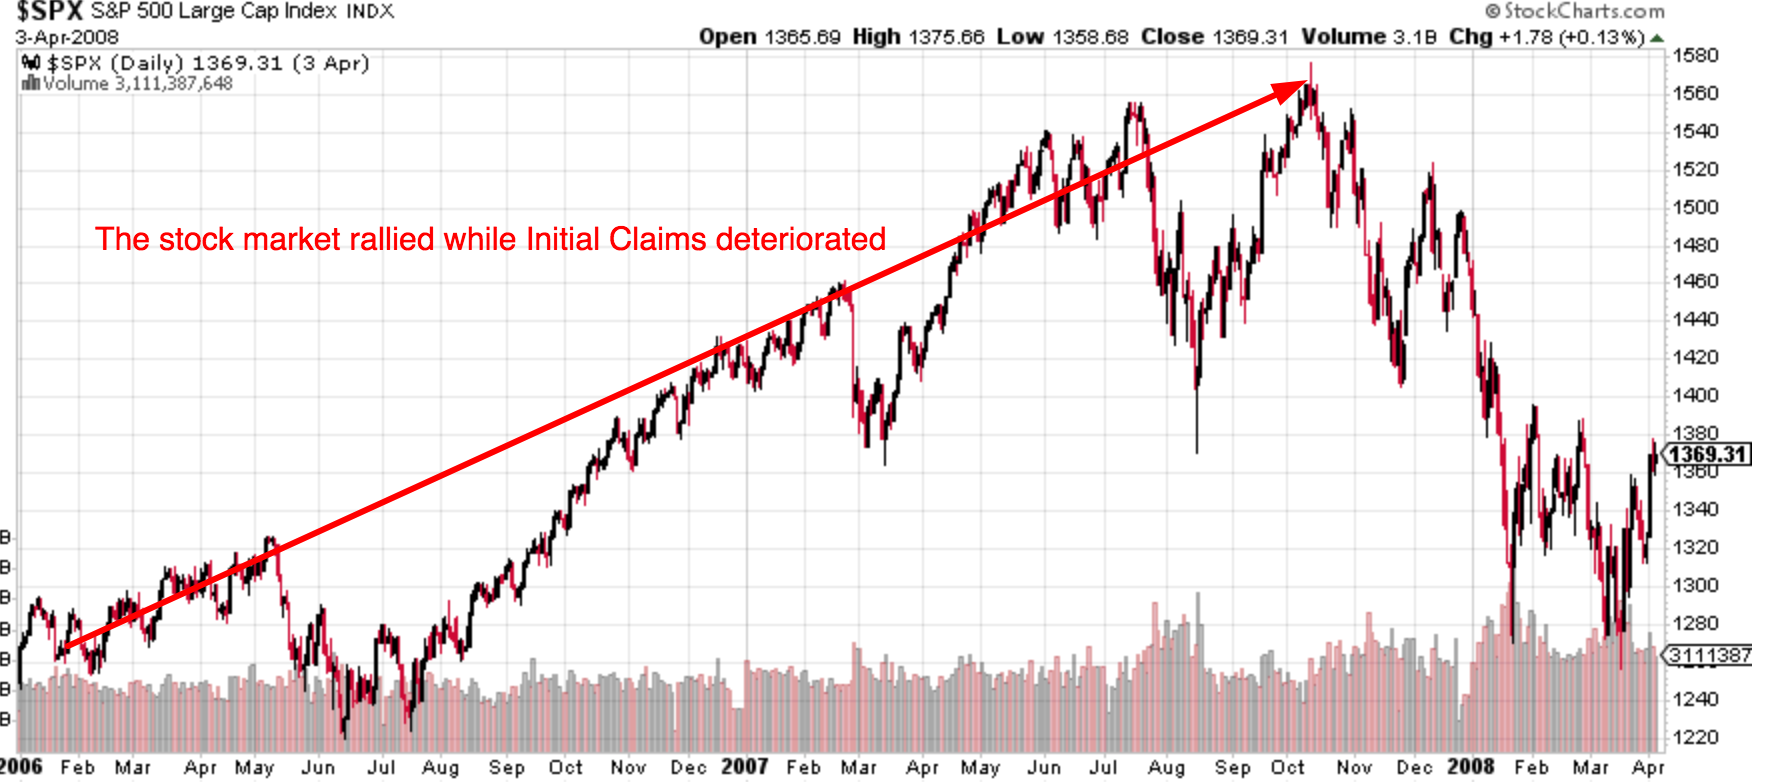
October 12, 2007
Initial Claims bottomed on January 28, 2006, more than 1.5 years before the bull market in stocks ended. The stock market and Initial Claims both trended higher during those 1.5 years.

Initial Claims was a leading indicator for the stock market in this case.
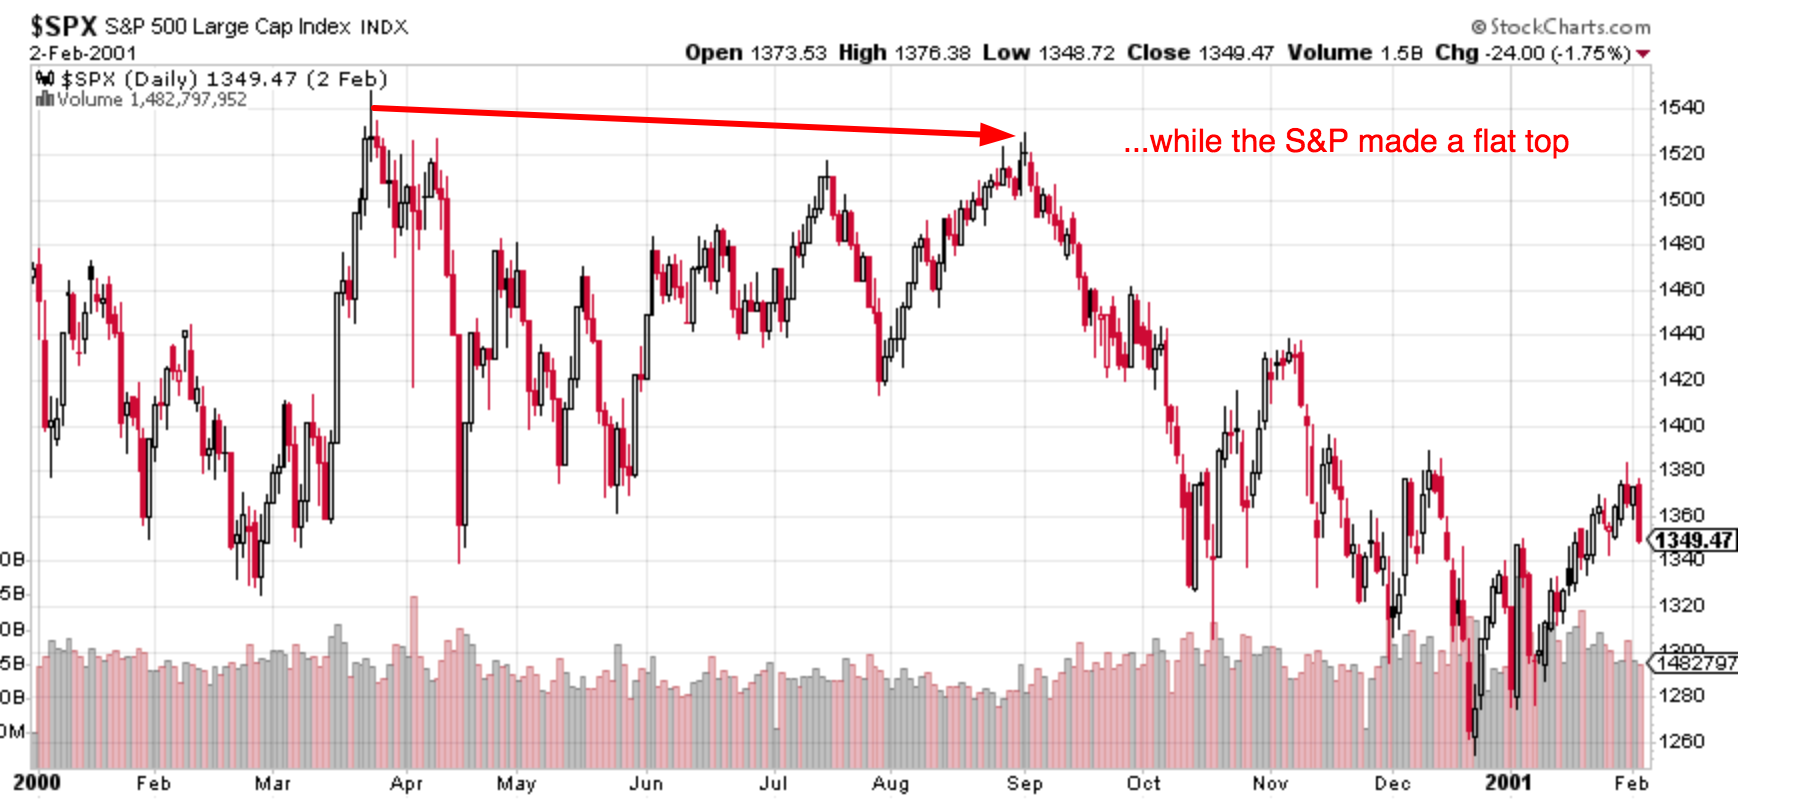
March 24, 2000
Initial Claims bottomed on April 15, 2000: 3 weeks AFTER the stock market peaked in this bull market cycle.
But here’s the key point: the S&P 500 almost made a double top on September 1, 2000 (it was 1.4% below its March 24 high). Hence we can use September 1 as the bull market’s high.
Initial Claims deteriorated and trended upwards from March 24 – September 1.
Initial Claims was a coincident indicator for the stock market in this case.


January 12, 1973
Initial Claims bottomed on January 27, 1973: 2 weeks after the stock market topped.
But here’s the key point: 1973 was not supposed to be a bear market. The Medium-Long Term Model initially predicted that this would be a “significant correction” (so we did get the SELL signal in 1972). But as more economic data came along, the model changed this “significant correction” prediction into a “bear market” prediction, which is precisely what happened.


Leave A Comment