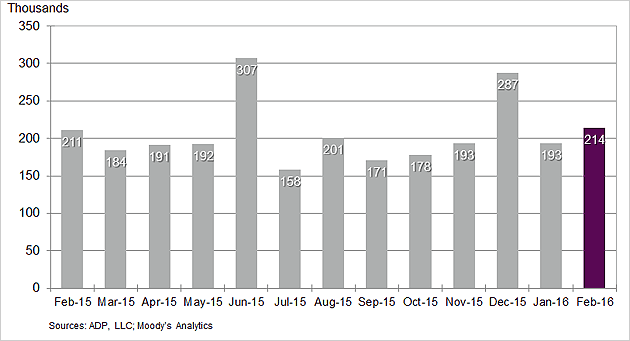
ADP reported non-farm private jobs growth at 214,000. The rolling averages of year-over-year jobs growth rate remains strong but the rate of growth continues in a downtrend (although insignificant again this month).

ADP changed their methodology starting with their October 2012 report, and ADP’s real time estimates are currently worse than the BLS.
Per Mark Zandi, chief economist of Moody’s Analytics:
Despite the turmoil in the global financial markets, the American job machine remains in high gear. Energy and manufacturing remain blemishes on the job market, but other sectors continue to add strongly to payrolls. Full-employment is fast approaching.
Per Ahu Yildirmaz, VP and head of the ADP Research Institute.
Large businesses showed surprisingly strong job gains in February, despite the continuation of economic trends that negatively impact big companies like turmoil in international markets and a strengthening dollar. The gains were mostly driven by the service sector which accounted for almost all the jobs added by large businesses.”
Jobs growth of 150,000 or more is calculated by Econintersect to the minimum jobs growth to support population growth (see caveats below). The graph below shows ADP employment gains by month. A graph in the caveats section below compares ADP employment to BLS.

Employment is a rear view indicator, and looking at this ADP data – the overall trend for the year-over-year rate of growth has been flat since mid-2010. (red line in graph below).
ADP Non-Farm Private Employment – Total (blue line) and Year-over-Year Change (red line)


Leave A Comment