EUR/USD
4 hour
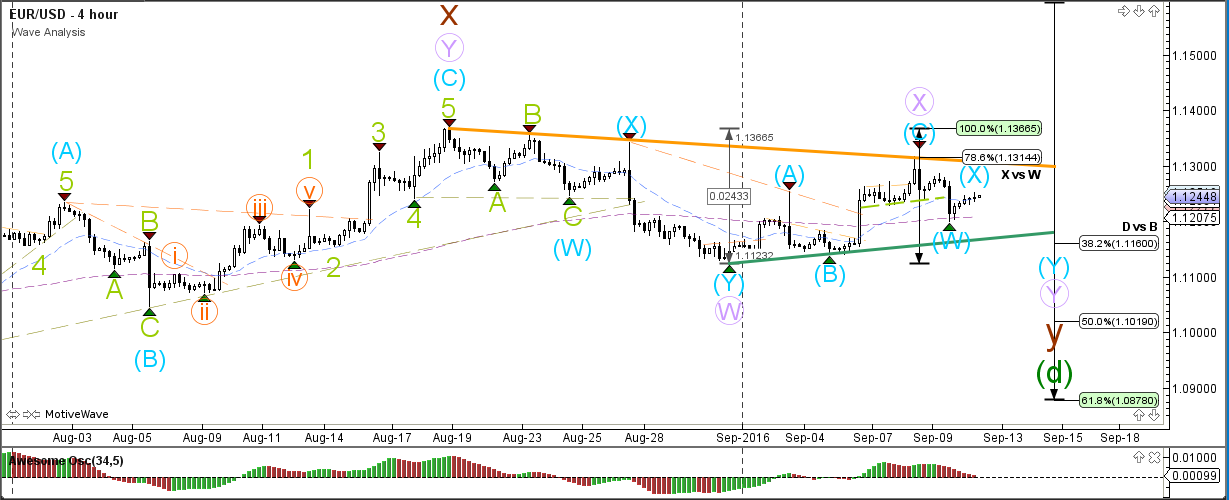
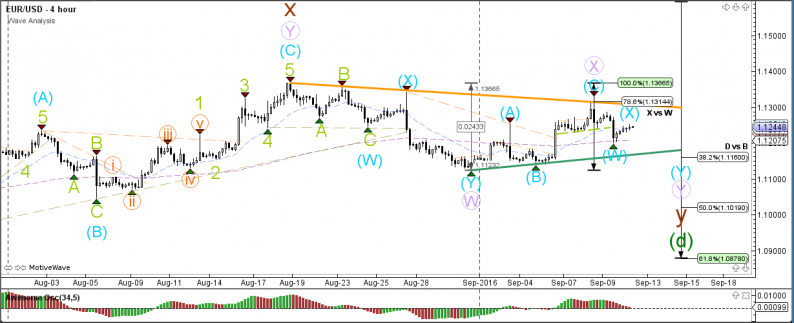
The EUR/USD made a bearish turn at the 78.6% Fibonacci level of wave X (purple) and the resistance trend line (orange). This confirms the development of a wave X (purple) within wave d (green), unless price breaks above resistance, which would indicate that a different wave X (brown) is still ongoing. Wave d (green) will most likely complete at the 61.8% Fibonacci support level (green box).
1 hour
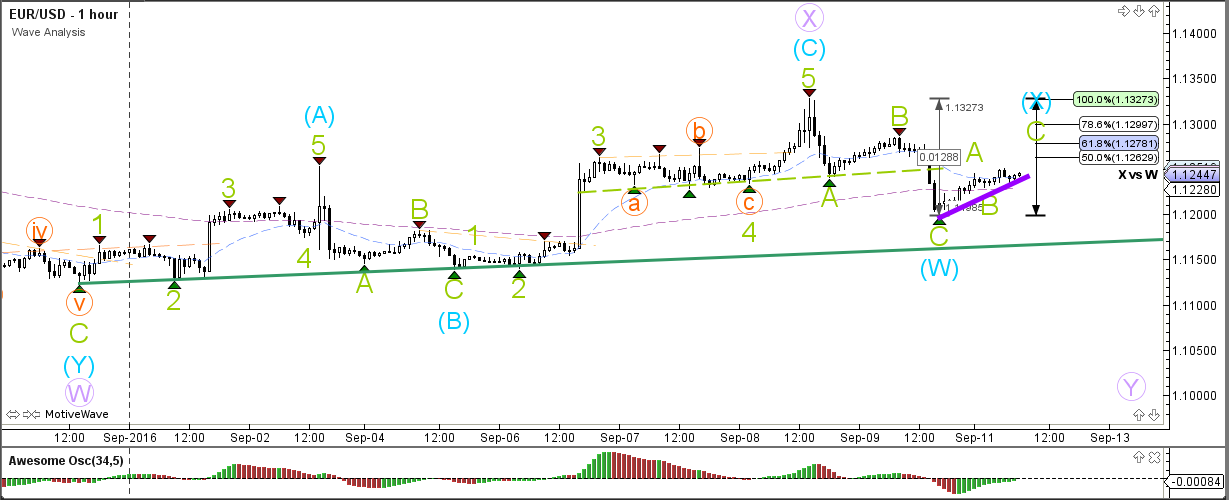
The EUR/USD is most likely building an ABC zigzag within wave X (blue) but a break above the 100% Fibonacci level invalidates wave X (blue). A break below the support trend line (purple) should indicate the start of wave Y (purple).
GBP/USD
4 hour
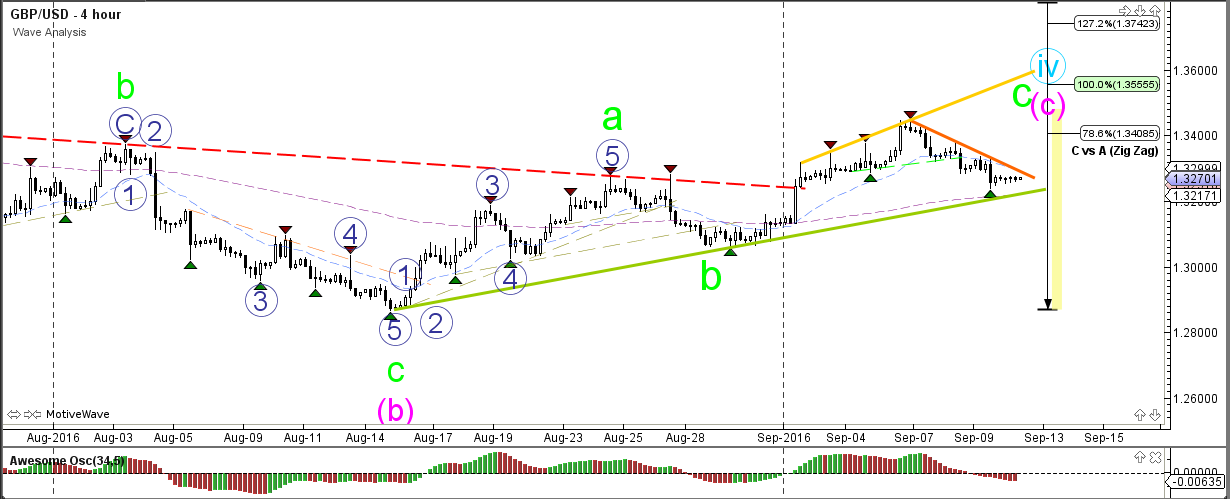
The GBP/USD is building an ABC zigzag correction (green/pink) after the break of the daily resistance trend line (dotted red). The current bearish price action is most likely part of a retracement. A breakout above resistance (orange) could indicate the potential continuation towards the Fibonacci levels of those C waves.
1 hour
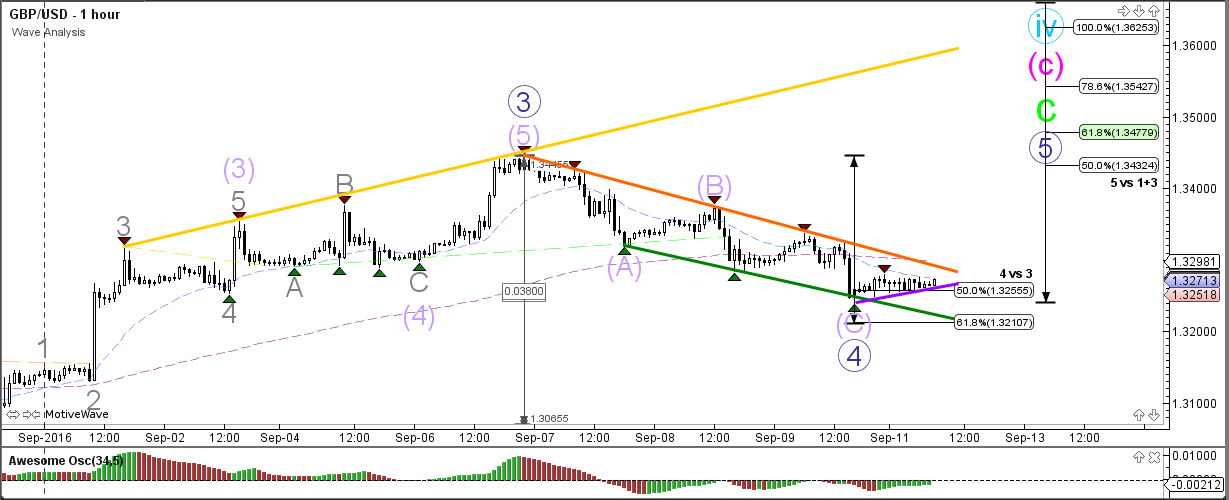
The GBP/USD built a bearish ABC zigzag (purple) which has respected the 50% Fibonacci retracement level of wave 4 (blue) vs 3. A break below support could see price move towards the 61.8% Fibonacci support level, which could be a potential bouncing spot. A break above resistance (orange) could confirm the start of wave 5 (blue) with targets at the Fib levels.
USD/JPY
4 hour
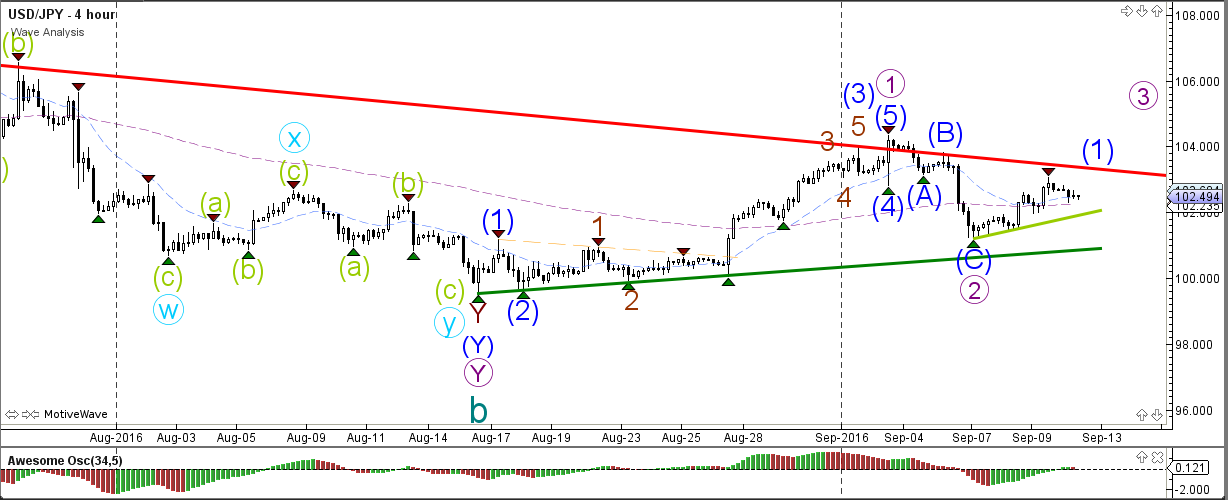
The USD/JPY is again approaching the resistance trend line (red) of the daily downtrend channel. A break above resistance (red) confirms the end of the downtrend and the start of bullish price action. A break below the round level of 100 and the support trend line (green) invalidates the current wave structure and indicates the continuation of the downtrend.
1 hour
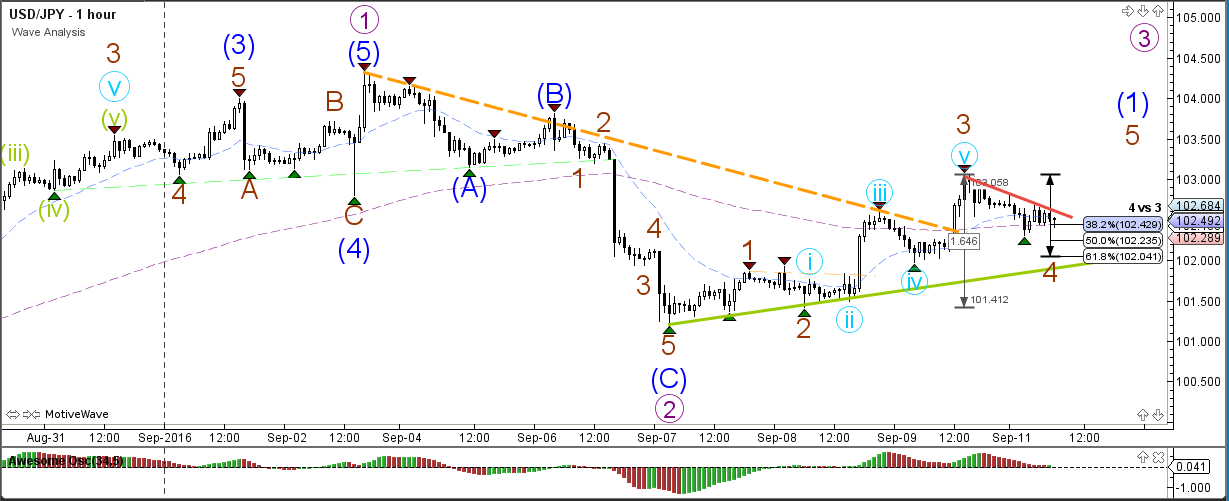
The USD/JPY is building a correction within a wave 4 (brown). A break above the resistance trend line (red) could signal the continuation of wave 5 (brown), while a break below the support trend line (green) invalidates wave 4 (brown).



Leave A Comment