GBP/USD
4 hour
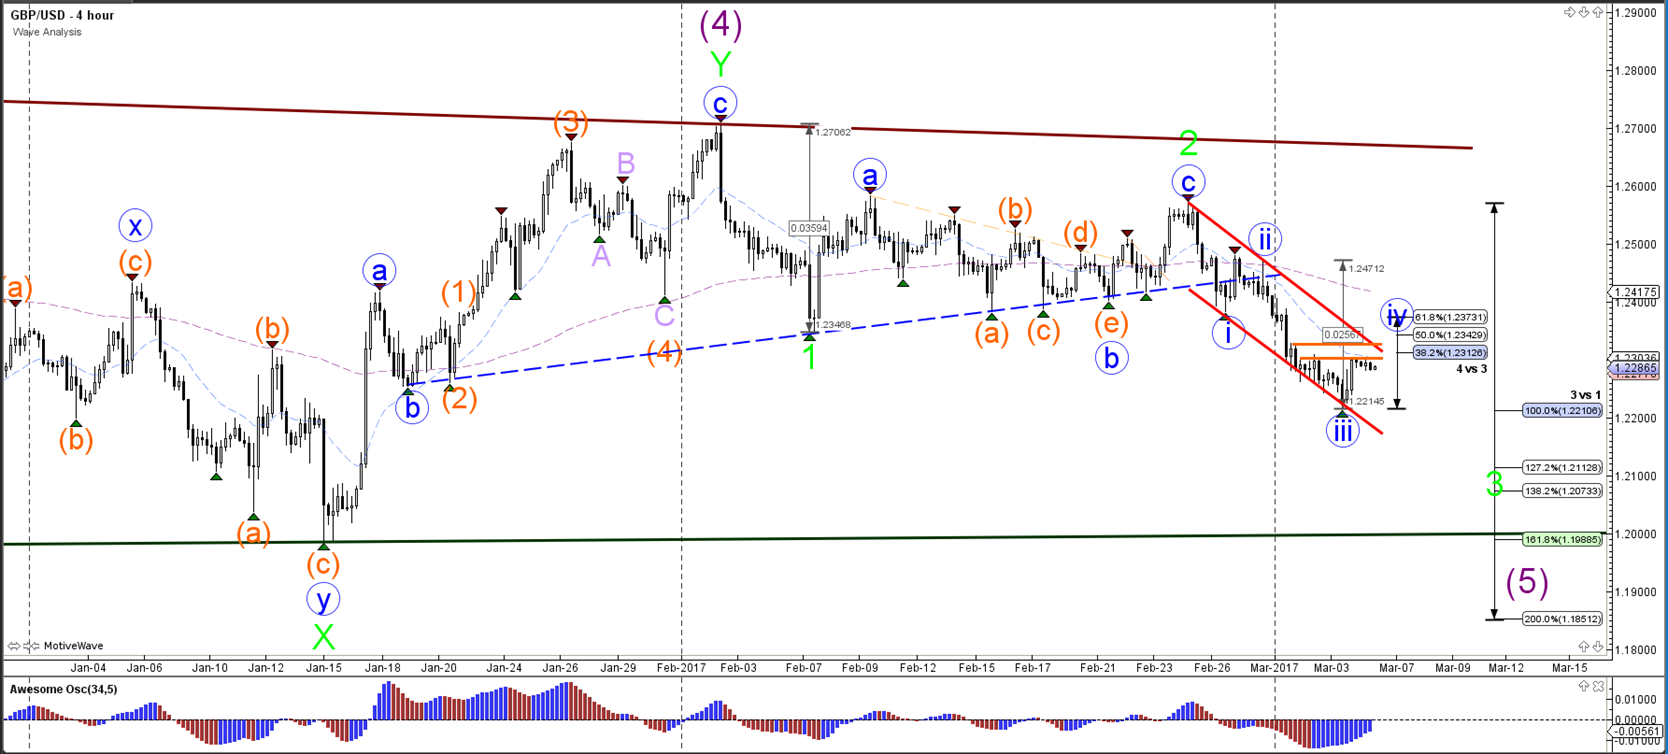
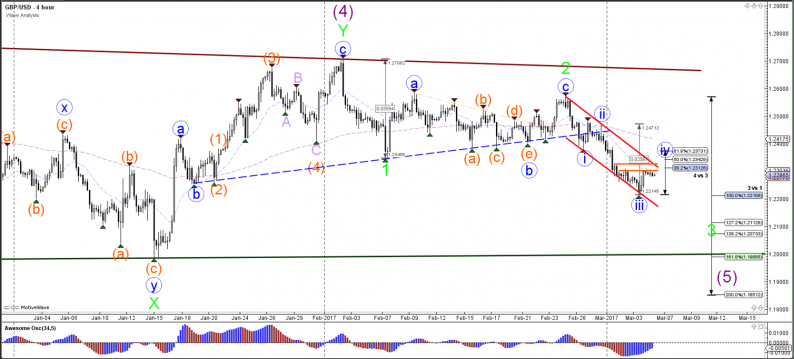
The GBP/USD bearish channel is neatly indicated by the trend lines (red). Price bounced at the bottom of the channel and is now approaching the top of the channel which typically acts as resistance. A bearish bounce could see price fall towards the Fibonacci levels of waves 3 (green) whereas a bullish breakout could see price challenge the Fibonacci of wave 4 vs 3. A break above the 61.8% Fib invalidates the wave 4 (blue).
1 hour
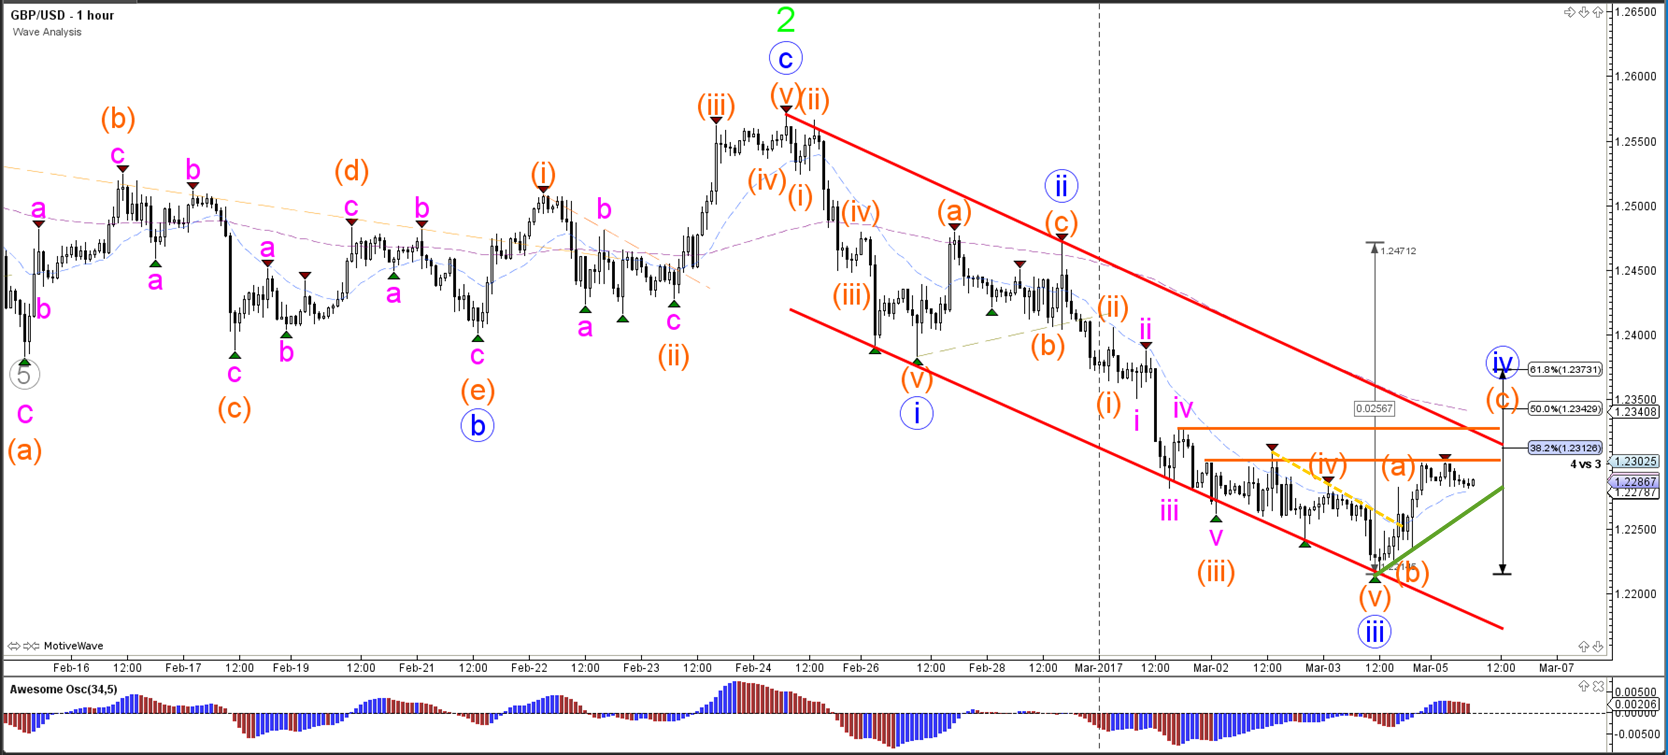
The GBP/USD retracement is in a wave 4 (blue) which typically retraces back to the 23.6% – 38.2% – 50% Fibonacci zone. A break above the 61.8% Fibonacci level invalidates this wave 4 (blue). A break below the support trend line (green) could see price continue with wave 5 (blue) within wave 3 (green) of the 4 hour chart.
EUR/USD
4 hour
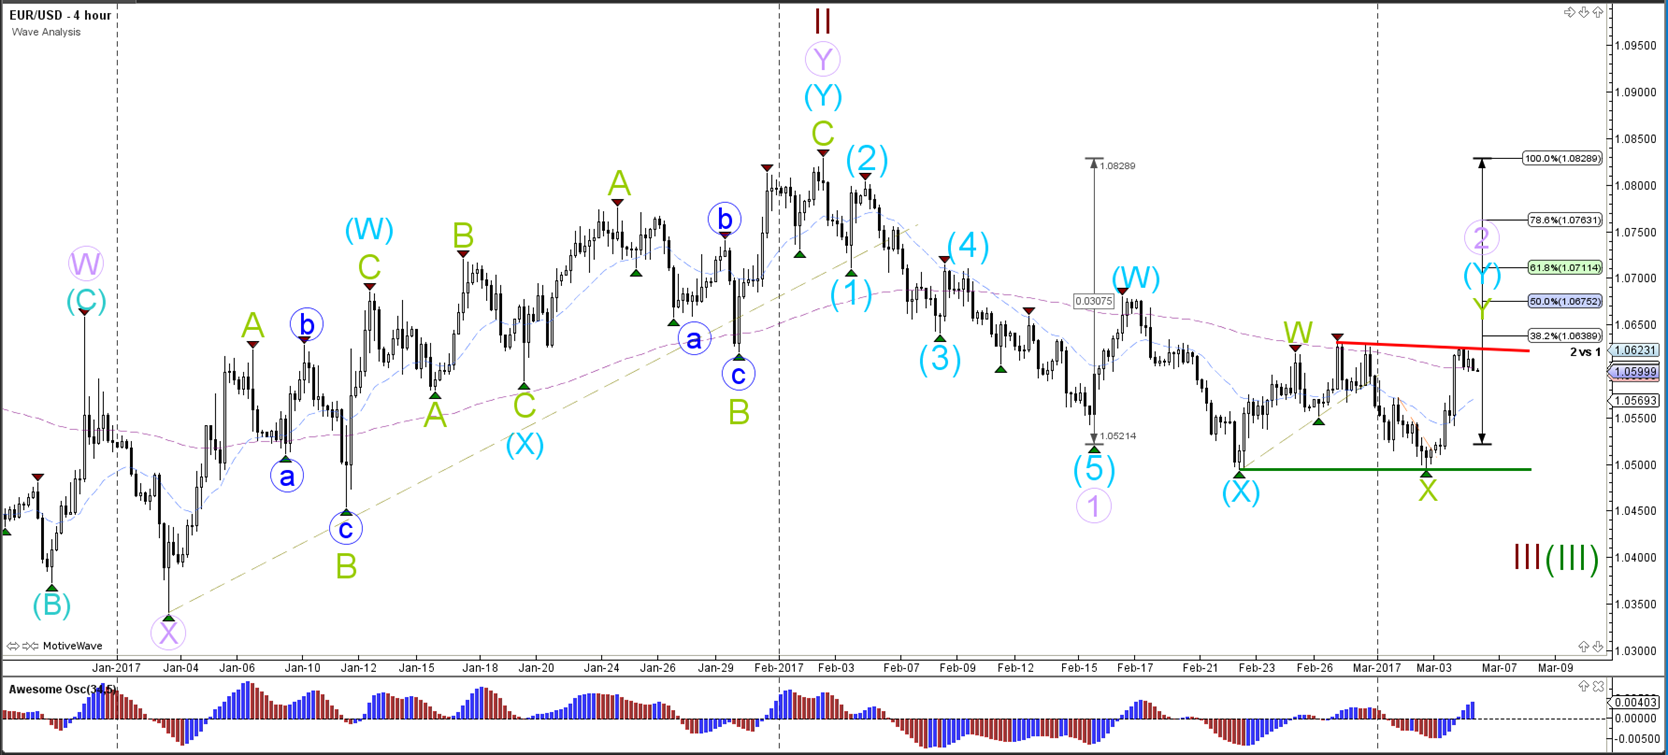
The EUR/USD indeed bounced at the support trend line (green) and is now retesting resistance (red) within wave 2 (purple). A break above resistance could see price move higher to test the Fibonacci levels of wave 2 (purple) but a push above the 100% level invalidates the wave structure. A bearish bounce and break below support (green) could see the downtrend continue within potential waves (brown/green).
1 hour
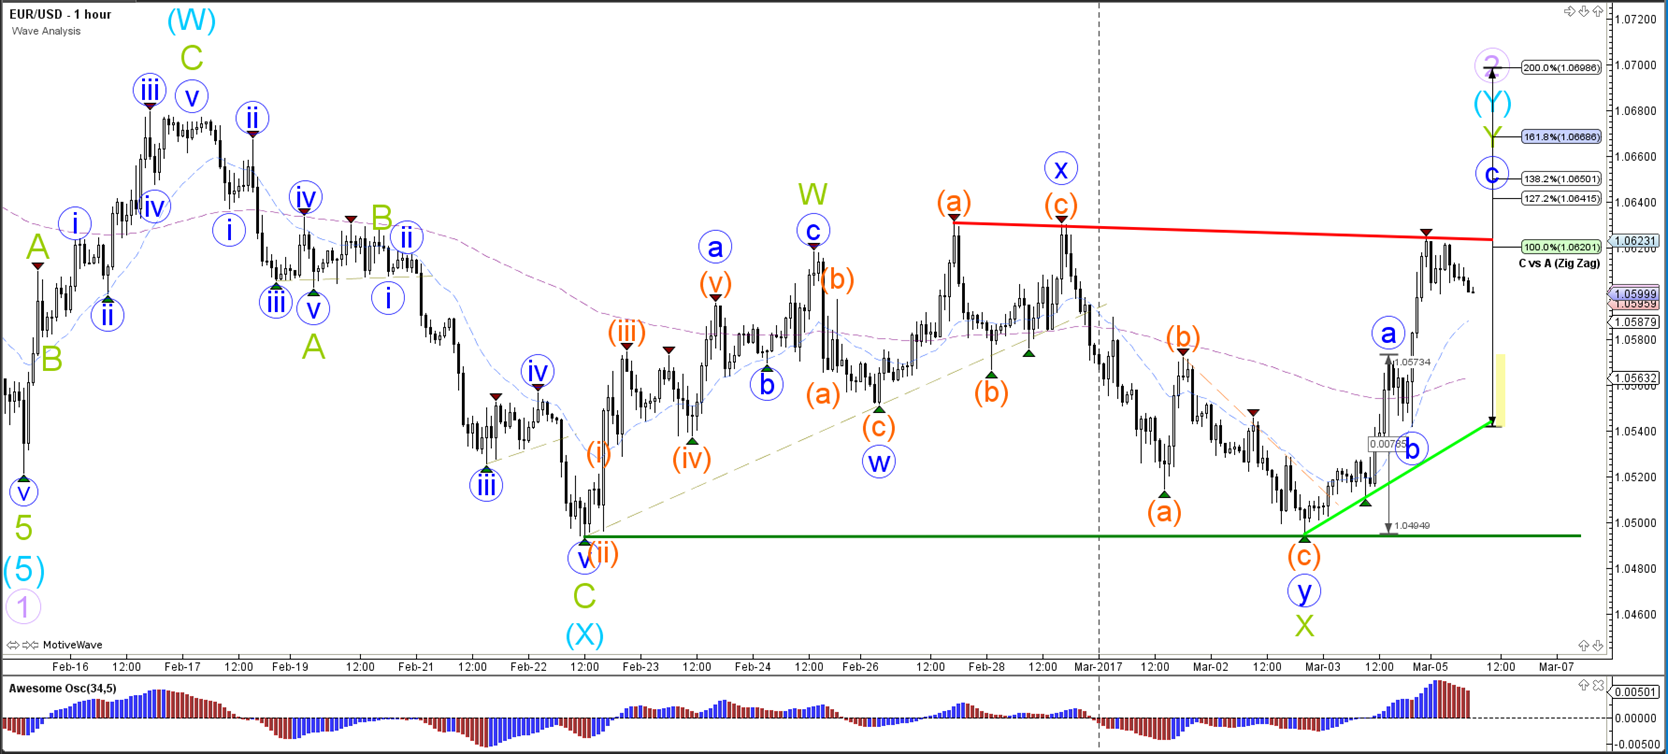
The EUR/USD seems to have completed a bullish ABC (blue) zigzag at the 100% Fibonacci target of wave C vs A.
USD/JPY
4 hour
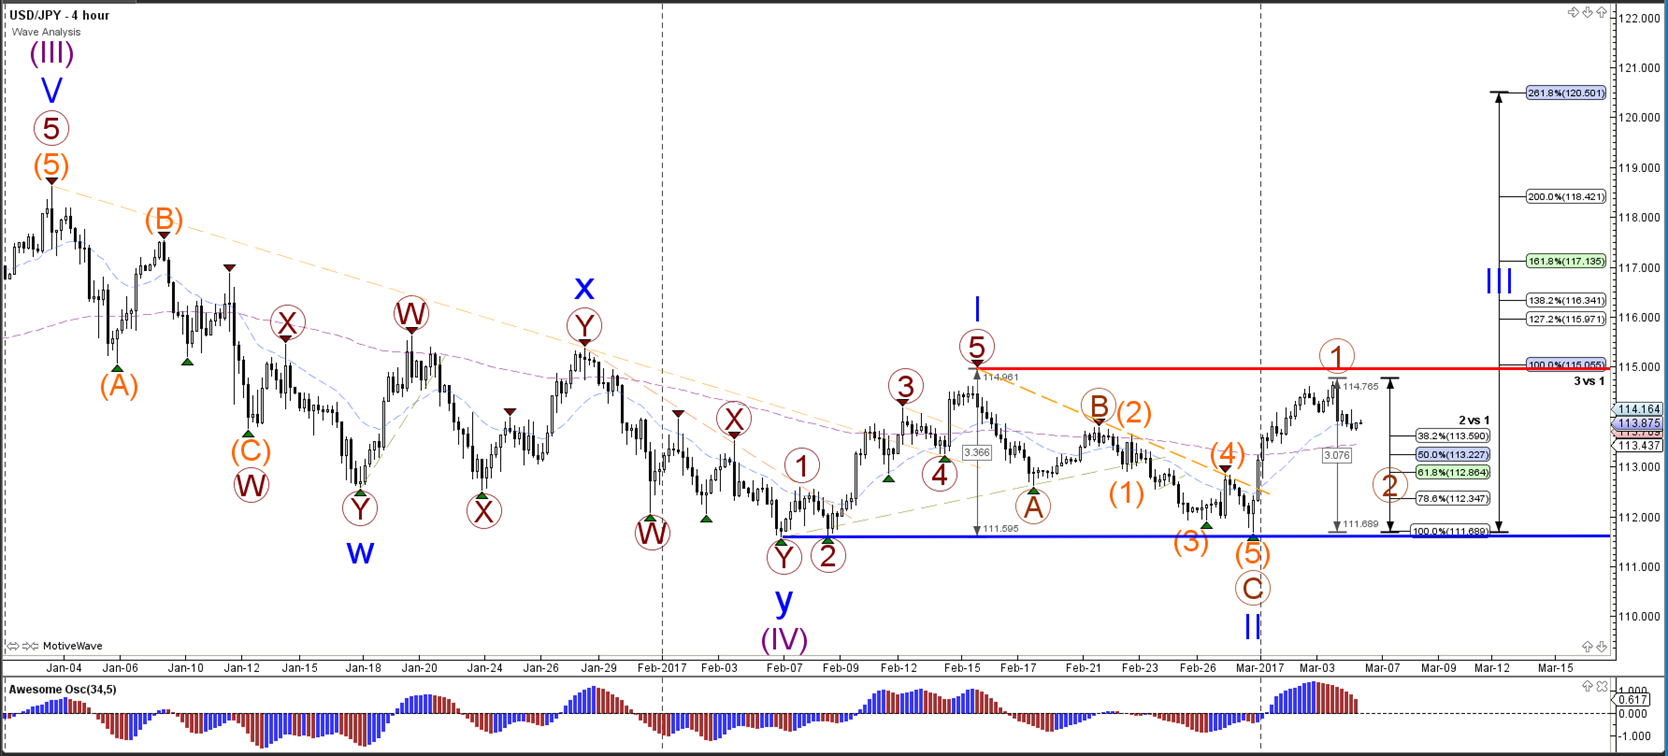
The USD/JPY is testing the resistance level (red line) and a break above it could see the USD/JPY continue with a wave 3 (blue) towards the Fibonacci targets.
1 hour
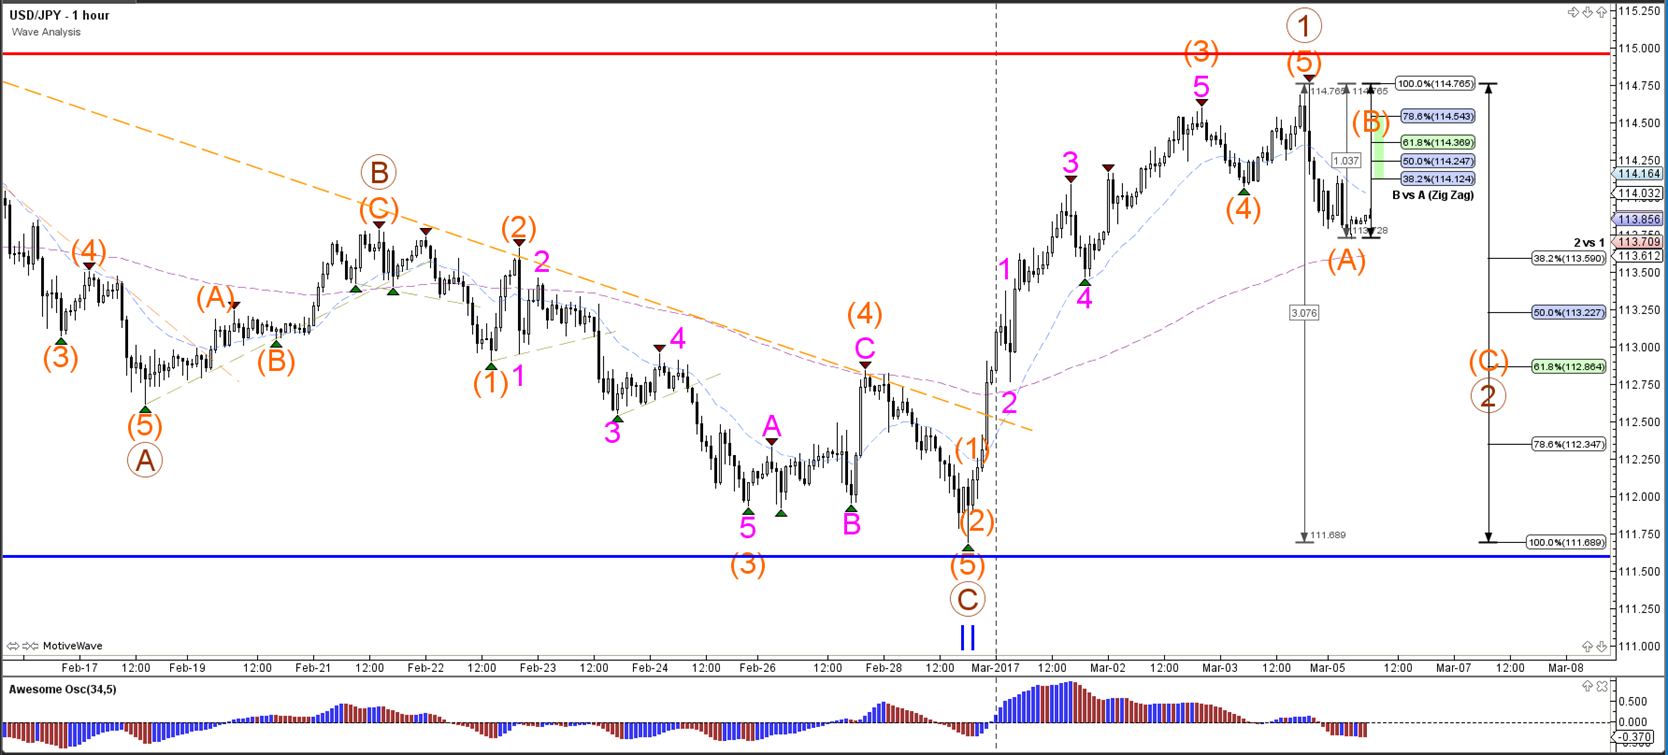
The USD/JPY could use the strong resistance (red) to bounce and build an ABC (orange) within wave 2 (brown) and retrace back to the Fibonacci levels of wave 2 vs 1 (brown).





Leave A Comment