GBP/USD
4 hour

The GBP/USD broke sturdily above the previous top which is indicated by the dotted red trend line. The breakout candle is showing strong momentum, which could indicate that the Cable could continue towards the Fibonacci targets of wave 5 vs 1+3.
1 hour

The GBP/USD is in a wave 3 (purple) momentum which could see a retracement develop within the wave 4 (purple) before price continues with the wave 3 (grey) of a higher degree. The Fibonacci levels of wave 4 vs 3 are therefore potential support levels that can be used for a bullish bounce. The broken resistance could also become potential support.
EUR/USD
4 hour

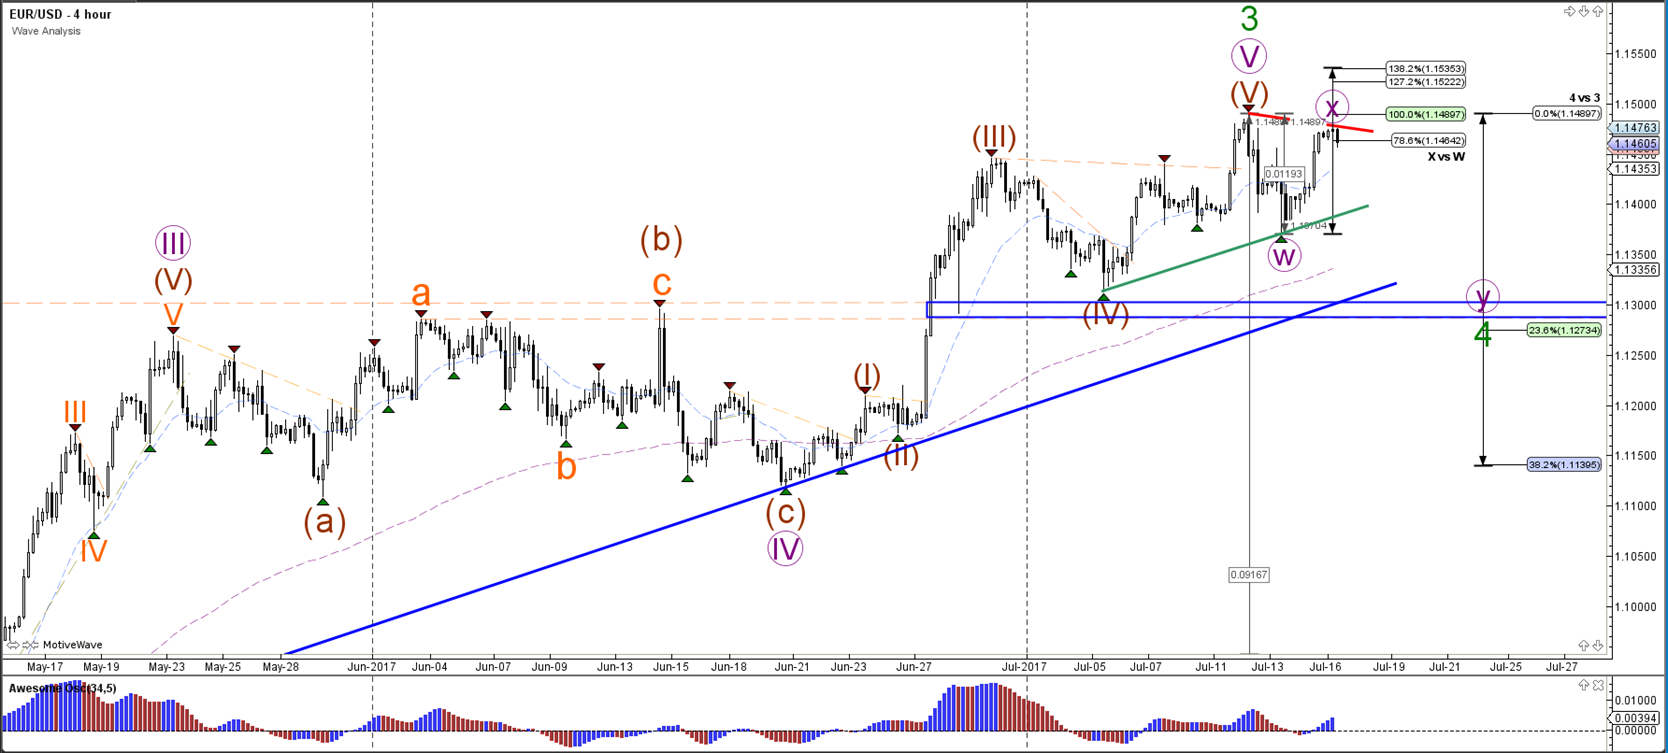
The EUR/USD is at a key decision spot: a bullish breakout above 1.15, the resistance trend line (red) would indicate and the 138.2% Fibonacci level would indicate a likely continuation of wave 3 (green). A bearish bounce however could confirm the wave X (purple) correction within a larger wave 4 (green).
1 hour

The EUR/USD has either completed an ABC (brown) correction or is showing a continuation of the uptrend. An important factor for this structure are the trend lines (red/blue). A break above resistance or below support could indicate the potential direction.
USD/JPY
4 hour

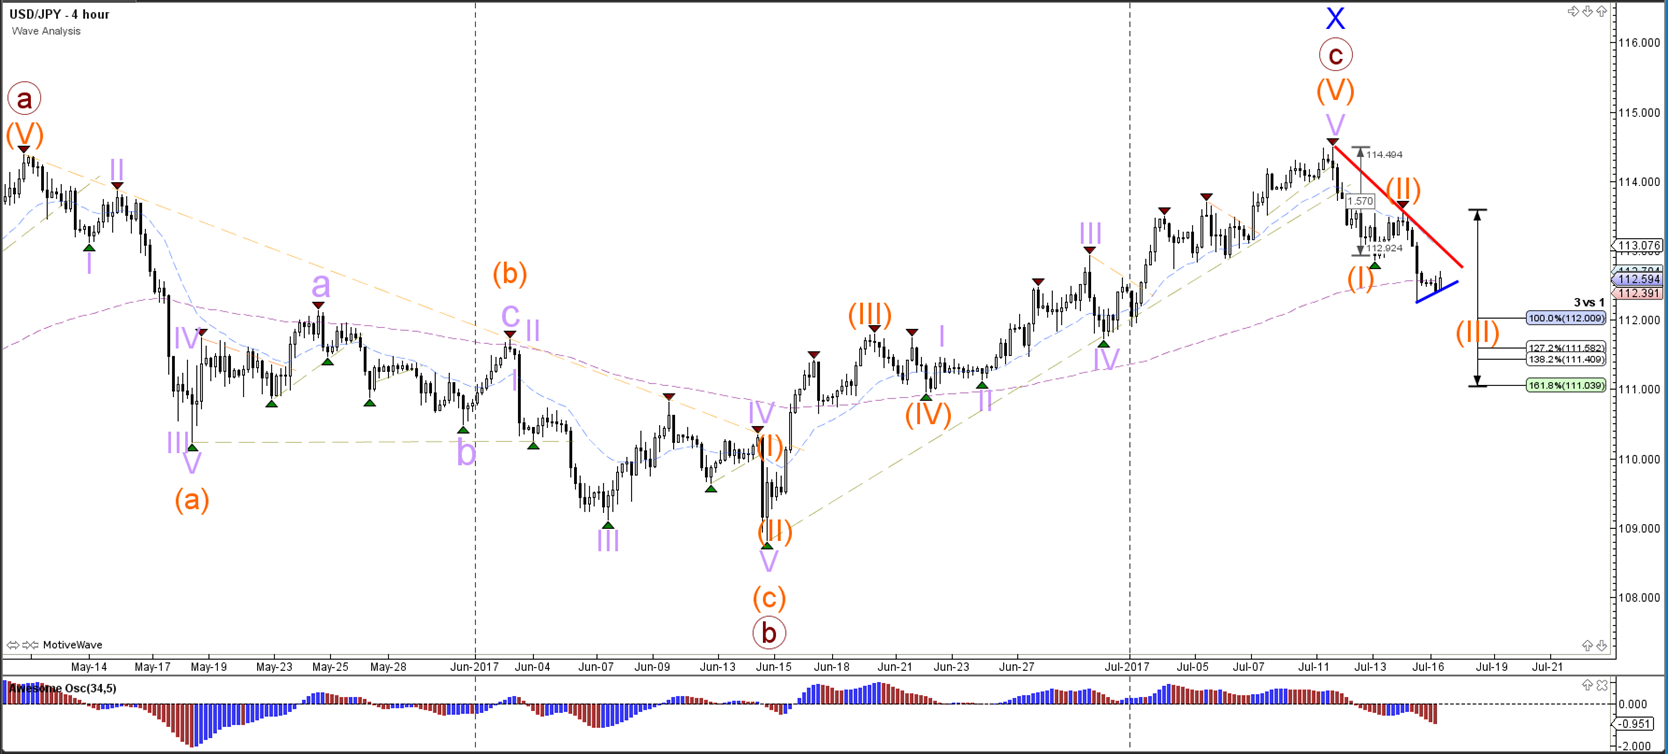
The USD/JPY is either in a new bearish trend (123 orange) or is building a bearish correction within a larger uptrend. A break below the support trend line (blue) is a first clue of a larger bearish reversal but price will need to reach at least the 161.8% Fib target of wave 3 vs 1.
1 hour

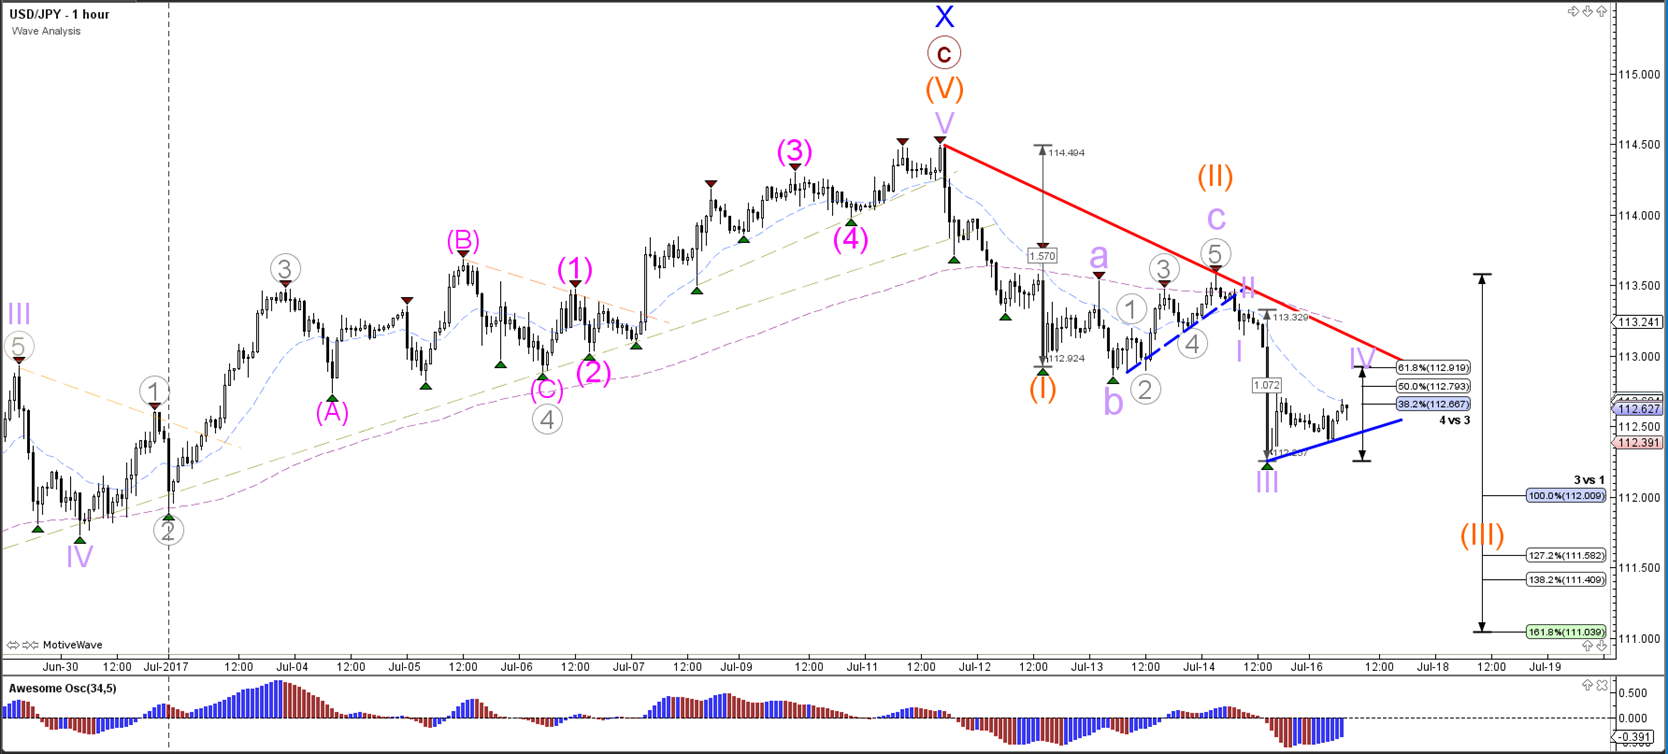
The USD/JPY could be in a wave 4 (purple) as long as price does not break above the 61.8% Fibonacci level of wave 4 vs 3 and the resistance trend line (red).


Leave A Comment