GBP/USD
4 hour

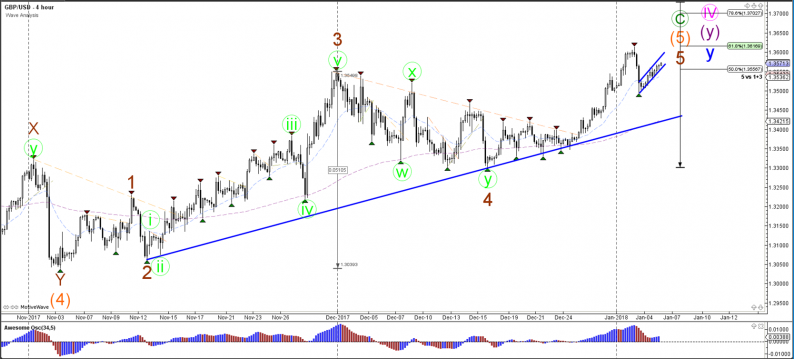
The GBP/USD bullish trend is continuing higher in a bullish channel (blue) after a bearish retracement back to the round level of 1.35. Price could be moving towards the Fibonacci targets of waves 5, which seems to be part of a wave C (green) although the previous top could be a tough resistance point.
1 hour

The GBP/USD could extend the bearish correction within wave 4 (blue) if price breaks below the channel. A break above the channel resistance could also indicate an acceleration of the bullish trend.
EUR/USD
4 hour

The EUR/USD uptrend continuation has reached the larger resistance zone (red lines) for the 2nd time. This is a particular difficult spot and a larger bearish correction could still emerge. However, a bullish breakout above 1.21 could indicate a wave 3 pattern and a continuation higher would become more likely.
1 hour

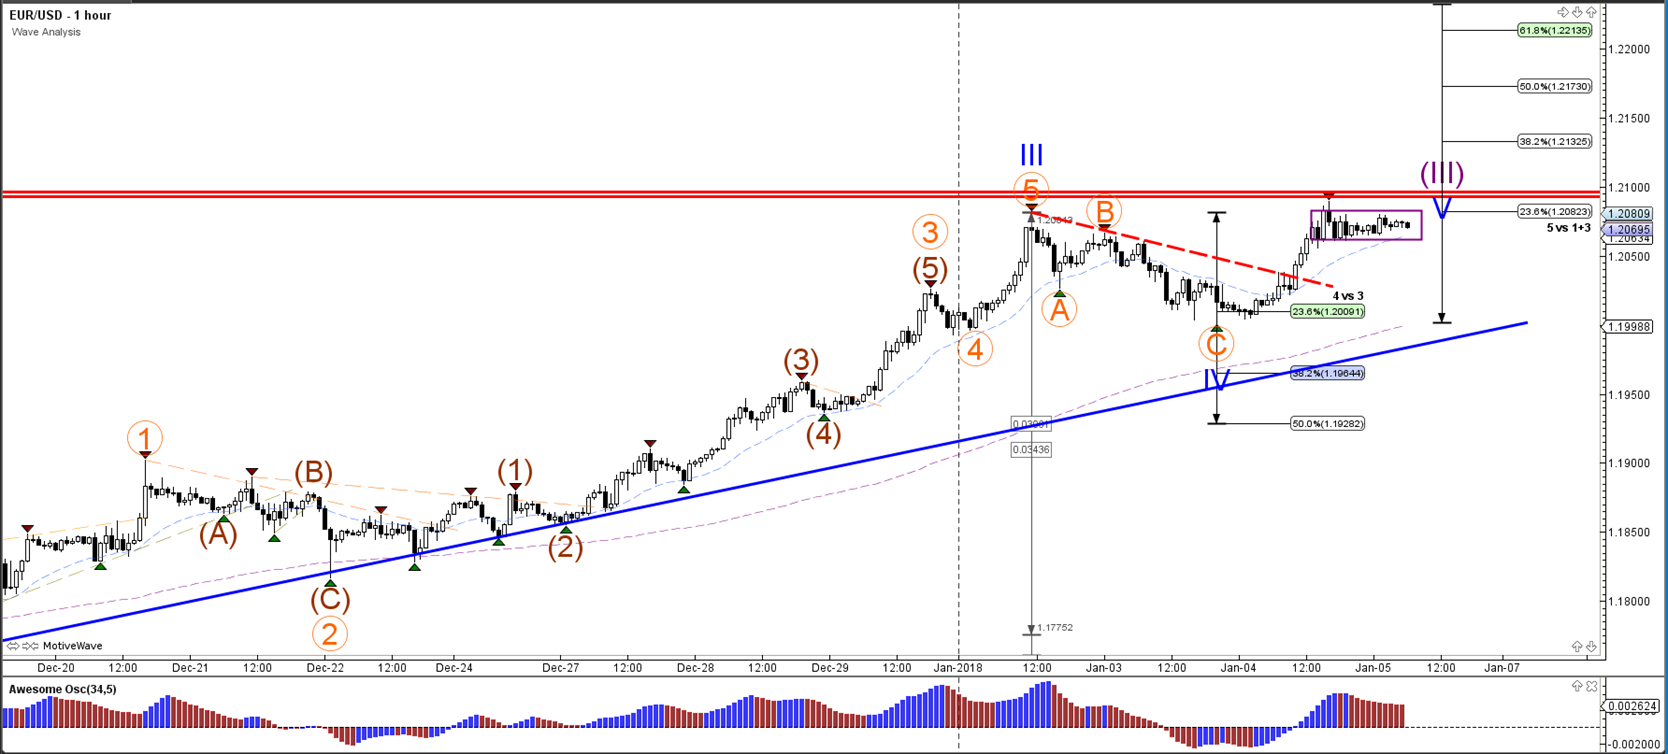
The EUR/USD is in a break or bounce spot. A bearish bounce could see price challenge the Fib levels again of wave 4 (blue) whereas a bullish break above the resistance trend line (red) could see price move towards the Fib targets of wave 5.
USD/JPY
4 hour

The USD/JPY break above the 2nd resistance trend line (dotted orange) could indicate a bullish breakout towards the next top (red). Although price is still in a large range, it could be the start of a larger bullish push higher.
1 hour

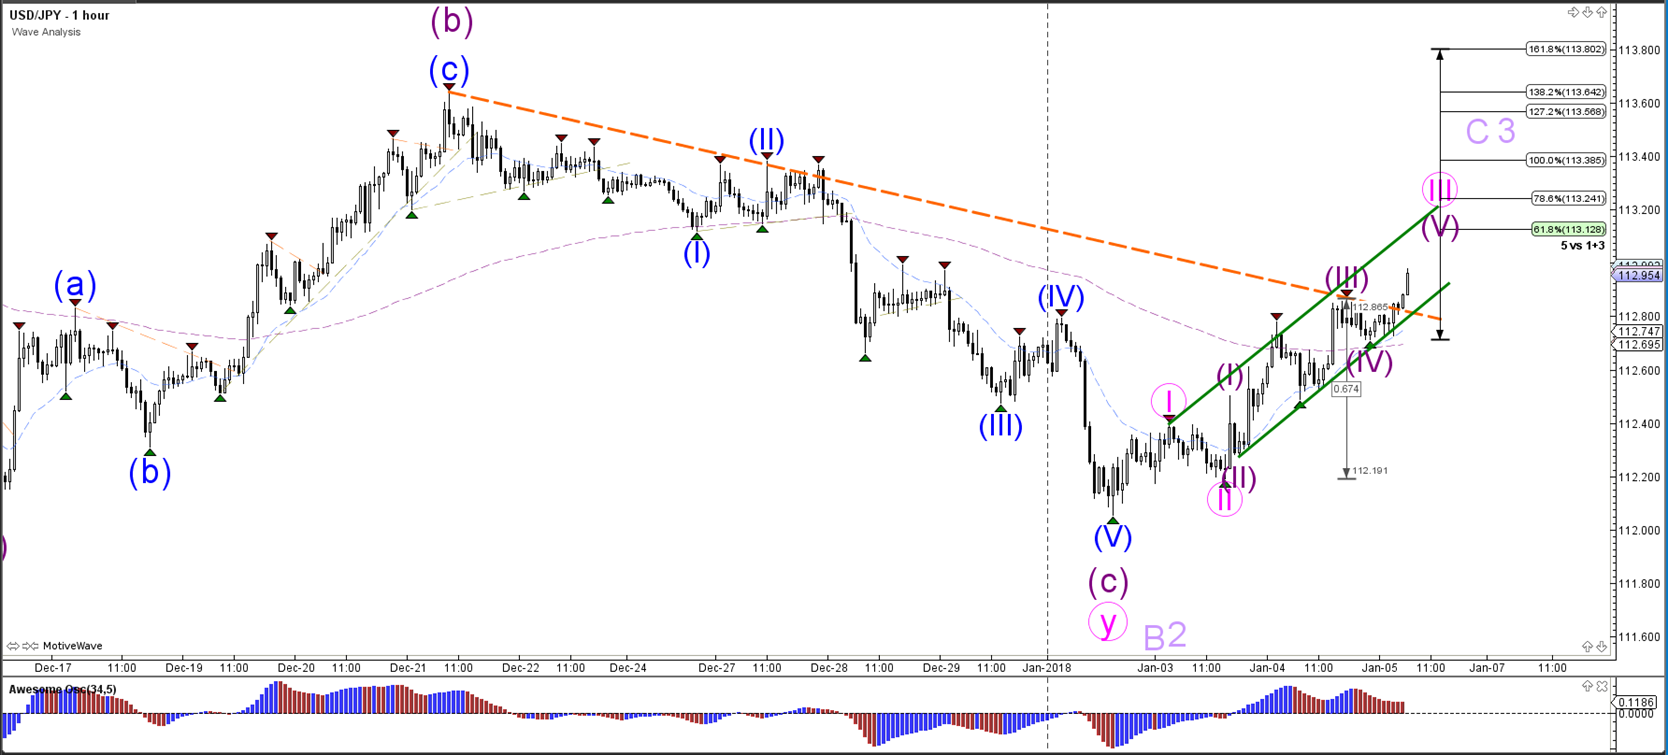
The USD/JPY broke above the resistance trend line (dotted orange) and could be in a wave 5 (purple) and moving towards the Fib targets.


Leave A Comment