GBP/USD Daily Chart

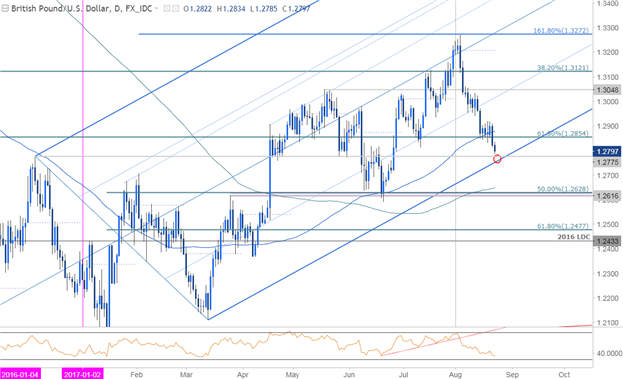
Technical Outlook: Last week we highlighted that ‘GBP/USD has been trading within the confines of an ascending pitchfork formation dating back to last year with an outside-day reversal at the highs shifting our focus lower earlier this month. Prices broke below slope support today with the decline now testing the 61.8% retracement at 1.2850.’
Prices sat on that level into the close of the week with a break yesterday now targeting more significant structural support at the December high / lower parallel at 1.2760/75– a level of interest for possible exhaustion. A break below this threshold would risk a drop towards the 200-day moving average / 50% retracement at 1.2628/45.
GBP/USD 120min

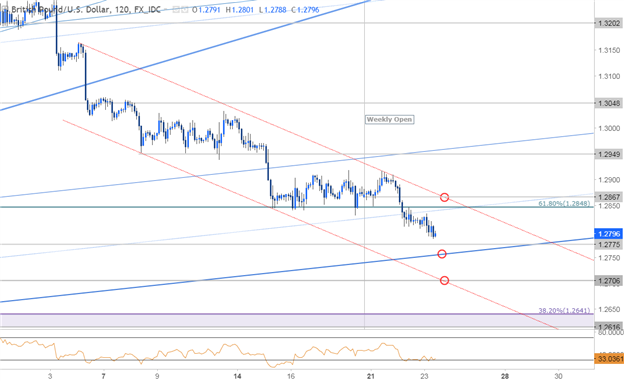
Notes: A closer look at price action shows cable trading within an embedded descending channel with the upper parallel converging on the weekly open at 1.2867–a breach above this region would be needed to mark a near-term reversal in the pair with such a scenario eying initial targets at1.2949.
That said, the immediate risk is lower and from a trading standpoint, I would be looking for a dip into the lower parallel for possible exhaustion / long-entries. A break below 1.27 would suggest the larger construct has been compromised and would keep the broader downside bias in play targeting 1.2641 & 1.2616.


Leave A Comment